In recent years, Uber’s self-driving cars, Google’s AlphaGo, quantitative trading, LinkedIn’s precise friend recommendations, and the Galapagos in Grasshopper that children are familiar with have all shown that machine learning is truly changing our lives, learning, and work.
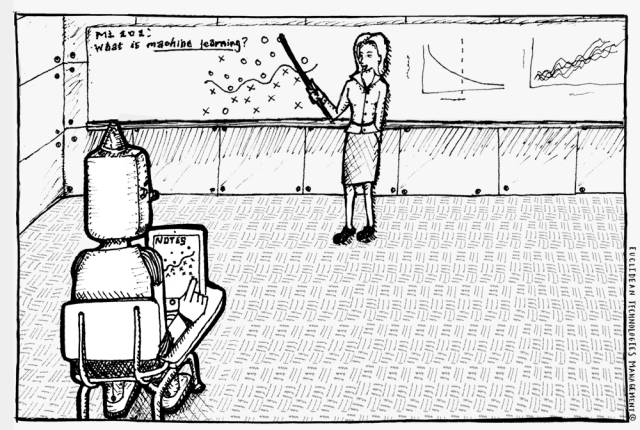
What Is Machine Learning?

Machine learning is a data analysis method that can automatically generate analytical models. By using specific algorithms to iterate multiple times, it learns from existing data, allowing computers to extract information from data (Data) without being explicitly programmed. (SAS)
Machine learning is a science of artificial intelligence, focusing primarily on how to improve the performance of specific algorithms through experiential learning. (Langley, 1996)
Machine learning is the study of computer algorithms that can automatically improve through experience. (Tom Mitchell, 1997)
Background of Machine Learning
Probability theory, statistics, approximation theory, convex analysis, computational complexity theory, biology, neurophysiology, automatic control, computer science, etc.
Application Areas of Machine Learning
Personal information recognition (advertising recommendations, credit ratings, etc.)
Computer vision (handwriting recognition, image search, etc.)
Natural language processing (spam classification, voice recognition, automatic translation, etc.)
Biometric recognition
Search engines
Device failure prediction
Network intrusion detection
Medical diagnosis
Credit card fraud detection
Stock market analysis
DNA sequencing
Strategic games
Robotics
…….
Although machine learning algorithms have been proposed for a long time (since the 1950s), it is only in recent years that machine learning methods for processing big data using complex computations have entered a rapid development phase (increasingly faster). This is due to the rapid development of the internet and the arrival of the self-media era, where the data available for learning is increasing exponentially, and the computing power of computers is also developing rapidly according to Moore’s Law. So overnight:
Google’s self-driving cars
Amazon Netflix online recommendations
Microsoft Cortana (Win 10) and Apple’s Siri
……
Have become popular across the country.
Because it is the core of artificial intelligence and the fundamental way to give computers intelligence.

Common Learning Methods in Machine Learning

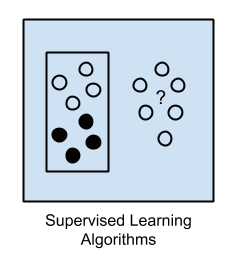
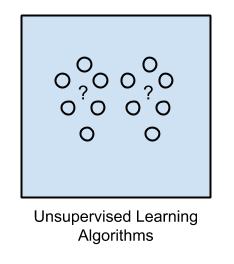
The two most widely used machine learning methods are supervised learning and unsupervised learning. Most machine learning (about 70%) is supervised learning, while unsupervised learning accounts for about 10%-20%. Sometimes semi-supervised and reinforcement learning methods are also used.
Supervised Learning algorithms utilize instances with classification labels (Label) to train machine learning models. For example, a series of patient information related to tumor benign or malignant (classification labels) such as age, gender, race, weight, etc. By labeling the data as “B” (Benign) or “M” (Malignant). The learning algorithm receives a series of input data with corresponding correct output values, and the algorithm learns through multiple iterations of comparing the actual output of the model with the correct output, modifying the model to reduce errors. Through classification, regression, prediction, and gradient ascent methods, supervised learning methods use models to predict the label values of other unlabeled data (for example, adding a new case, whether the tumor is malignant). Supervised learning methods are widely used to predict future events based on historical data. For example, predicting when a credit card transaction might be fraudulent or which insurance client might file a claim.
Unsupervised Learning uses data without classification. The system is not told the “correct answer”. The algorithm must figure out what these data present by itself. The goal is to explore the data and find some internal structure. Unsupervised learning works well with transactional data. For example, it can identify customer groups with similar characteristics (for marketing purposes), or it can find features that distinguish customer groups from each other. Popular methods include self-organizing maps, nearest-neighbor mapping, k-means clustering, and singular value decomposition. These algorithms are also used for text segmentation, recommendation systems, and identifying outliers in data.
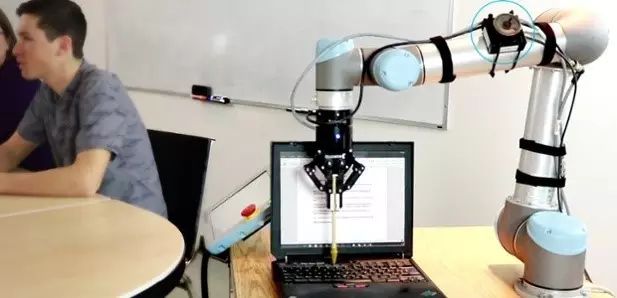
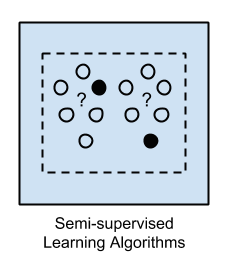
Semi-supervised Learning uses the same methods as supervised learning, but it simultaneously uses both labeled and unlabeled data for training—usually, the learning data consists of a small amount of labeled data and a large amount of unlabeled data (because unlabeled data is very easy to obtain). This type can use learning methods such as classification, regression, and prediction. When a fully labeled supervised learning process is too costly due to its related labels, semi-supervised learning can be used, for example, using a webcam to recognize faces.
Reinforcement Learning is often used in robotics, games, and navigation. The algorithm learns through trial and error to maximize rewards. This learning consists of three main components: the agent (learner or decision-maker), the environment (everything the agent interacts with), and actions (what actions the agent can take). The goal is to maximize the reward of the actions chosen by the agent over a given time. With a good strategy, the agent will reach the goal faster. Therefore, the objective of reinforcement learning is to obtain the best strategy.
Machine Learning Algorithms and Tools

Algorithms
Most architecture students should come from a science background, so they can first recall high school statistics knowledge:
Bias: Describes the difference between the expected value E of the prediction (estimation) and the true value T. The larger the bias, the further it deviates from the true data.

Variance: Describes the range of variation of the predicted value P, the degree of dispersion, which is the distance from its expected value E. The larger the variance, the more dispersed the data distribution.

The true error of the model is the sum of the two, as shown in the figure below:

The purpose of machine learning is to minimize the true error of our model function f^(x) and the true function f(x) through certain processing. At this point, we can introduce the gradient descent method.
Gradient Descent Method
Starting with the simplest two variables (modeling the function between house price and area).
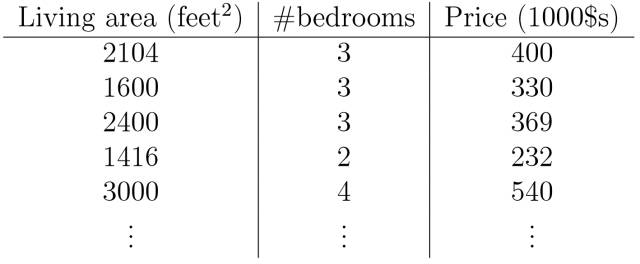
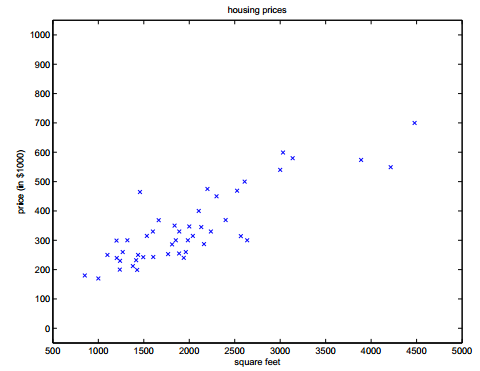
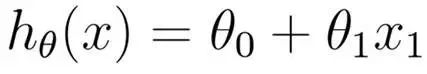
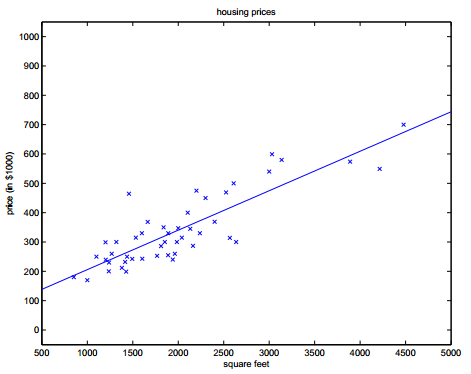
By establishing the error function (i.e., the variance formula, where 1/2 is for convenience of calculation):
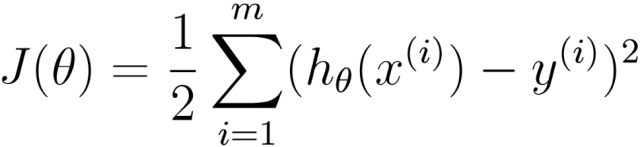
Thus, we have the gradient descent algorithm for the error function J(θ):
o (1) Initialize θ (random initialization)
o (2) Iterate, the new θ should make J(θ) smaller
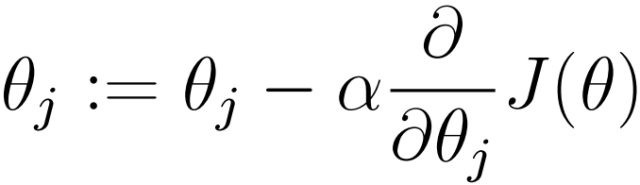
o (3) If J(θ) can continue to decrease, return to (2) where
α is called the learning rate
The gradient direction is
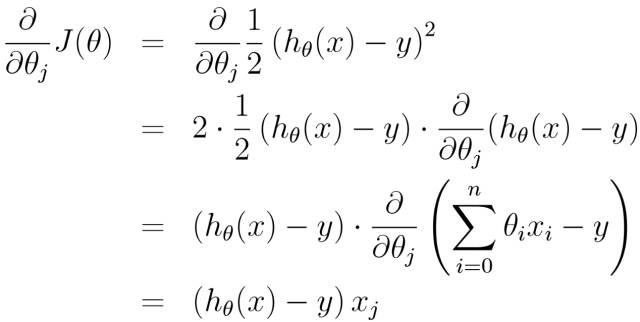
Thus, we have:
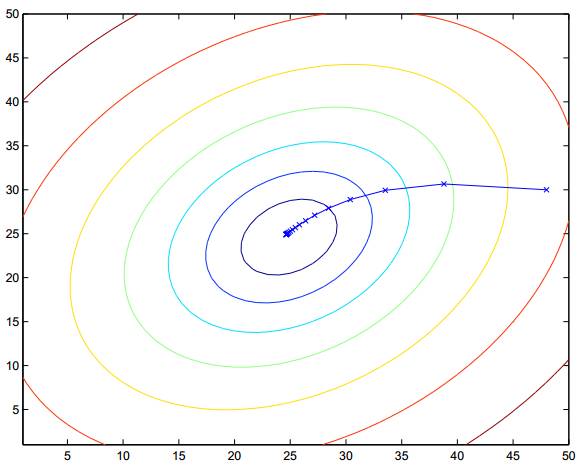
Expanding this to a multi-dimensional case:
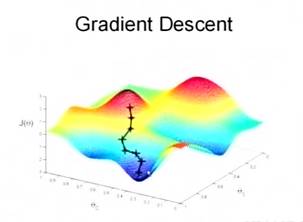
In simple terms, it is similar to the principle of water droplets converging in the terrain in Kangaroo.
Of course, there are also commonly used similar functions such as
Newton’s Method
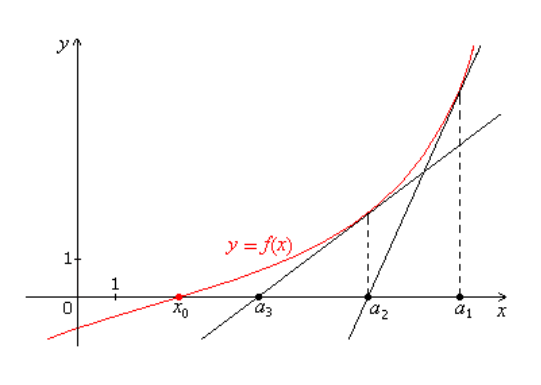
By repeatedly finding the intersection point of the tangent line at a point with the coordinate axis (in multi-dimensional cases, it is the hyperplane), we can obtain the model function. Compared to gradient descent, Newton’s method converges faster, usually requiring only a dozen iterations or less to converge. Newton’s method is also known as quadratic convergence because when iterating close to the convergence point, each iteration can reduce the error to the square of the previous error. The downside is that when the parameter vector is large, each iteration requires calculating the inverse of the Hessian matrix, which is time-consuming.
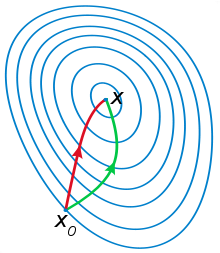
The red curve is the solution using Newton’s method, while the green curve is the solution using the gradient descent method.
With the above algorithms, we can roughly solve the fitting problem for multi-variable models. In life, there is also a large category of problems which are classification problems, such as the tumor benign vs malignant discrimination problem mentioned earlier.
By establishing a function, we can transform classification problems into function problems in a simple way.
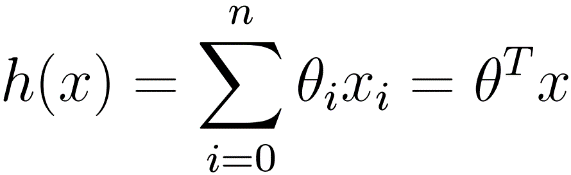
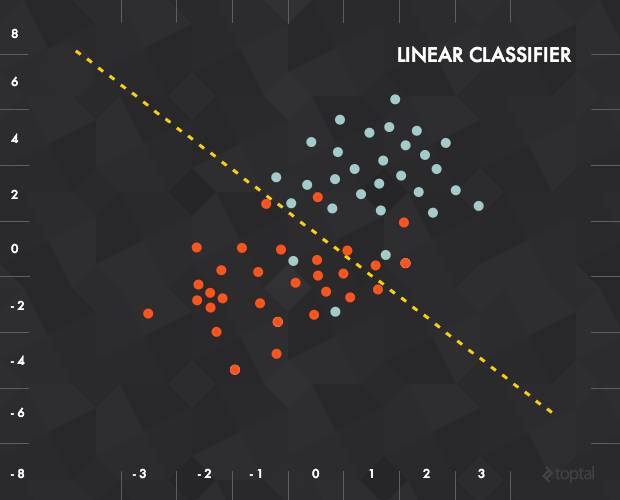
In a two-dimensional example, we can represent each input data as a vector x =(x_1, x_2), and our function is to achieve “output 0 if below the line; output 1 if above the line”.
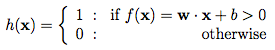
Mathematically, we define a weight vector w and a vertical offset b. Then, we combine the input, weight, and offset to obtain the following transfer function:
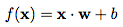
The result of this transfer function will be input into an activation function to produce a label. In the above example, our activation function is a threshold cutoff function (i.e., output 1 after exceeding a certain threshold):
This classification method essentially classifies data points by establishing an exponential distribution family.
By introducing the exponential distribution family, we can transform this classification problem into a function problem that can be handled by gradient descent and Newton’s method. That is, generalized linear models (GLMs) obtain different models by assuming a probability distribution, while both gradient descent and Newton’s methods are aimed at obtaining the parameters θ of the linear part (θTx) in the model.
Exponential Distribution Family Forms
Bernoulli distribution: modeling for 0 and 1 problems;
Multinomial distribution: modeling events with K discrete outcomes;
Poisson distribution: modeling counting processes, such as counting website visits, radioactive decay, customer counts in stores, etc.;
Gamma and exponential distributions: modeling positive numbers with intervals, such as bus arrival time issues;
Beta distribution: modeling decimals;
Dirichlet distribution: modeling probability distributions;
Wishart distribution: distribution of covariance matrices;
Gaussian distribution;
By establishing the models mentioned above, we have obtained the two most basic ways of machine learning.
Optimizing, implementing, or combining these two basic methods leads to more advanced learning algorithms:
Neural networks
Decision trees
Random forests
Association and sequence discovery
Gradient boosting and bagging
Support vector machines
Nearest-neighbor mapping
k-means clustering
Self-organizing maps
Local search optimization techniques, e.g., genetic algorithms.
Expectation maximization
Multivariate adaptive regression splines
Bayesian networks
Kernel density estimation
Principal component analysis
Singular value decomposition
Gaussian mixture models
……
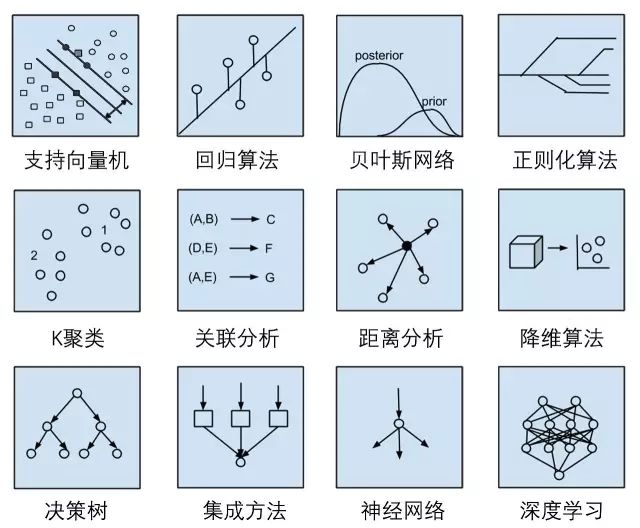
To illustrate with a diagram, still confused? No worries, there are many tools to help us implement the algorithms mentioned above.
Tools
1. SAS
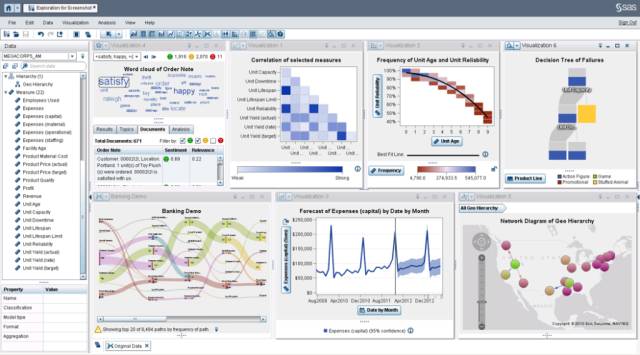 SAS is rich and powerful (including plotting capabilities) and supports programming to extend its analytical capabilities, suitable for complex and high-demand statistical analyses.
2. Matlab
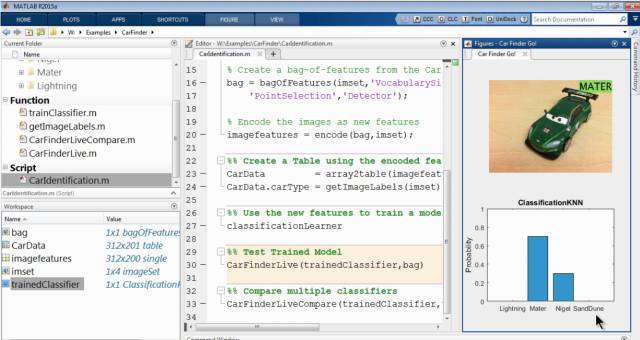 Matlab also provides a large number of data mining algorithms, focusing more on the field of scientific and engineering calculations.
3. SPSS Modeler
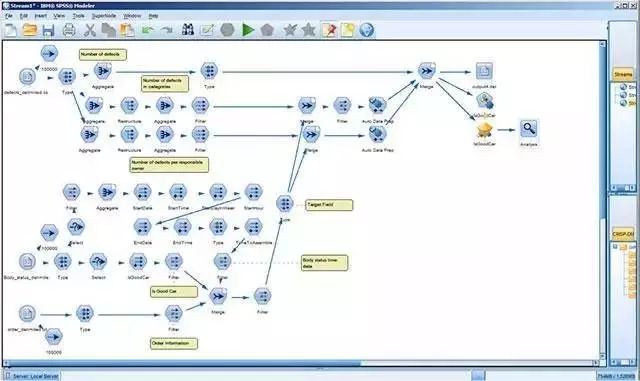 SPSS Modeler has relatively limited statistical functions, mainly providing implementations of machine learning algorithms aimed at business mining (decision trees, neural networks, classification, clustering, and prediction, etc.). Meanwhile, its data preprocessing and result auxiliary analysis capabilities are also quite convenient, especially suitable for rapid mining in business environments. However, in terms of processing capacity, it feels difficult to cope with data scales exceeding hundreds of millions.
4. Tableau
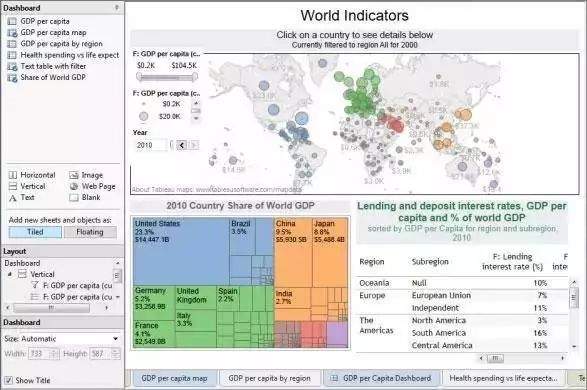
Tableau’s advantages mainly lie in supporting various big data sources/formats, numerous visualization chart types, and a drag-and-drop usage style, making it easy to use, very suitable for researchers, and capable of covering most analysis research scenarios. However, it should be noted that it cannot provide support for classical statistics and machine learning algorithms, so it can replace Excel, but cannot replace statistical and data mining software. Additionally, in terms of actual processing speed, it feels that when facing large data (instances exceeding 30 million records), it is not as fast as officially advertised.
5. Weka
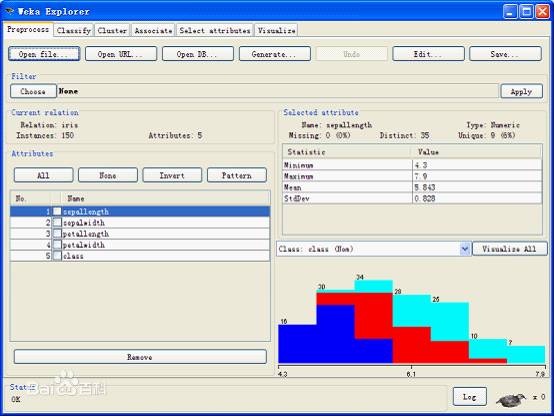 A data mining tool developed based on Java, it provides users with a series of data mining APIs, command line, and graphical user interfaces. You can prepare data, visualize, build classifications, perform regression analysis, build clustering models, and execute other algorithms through third-party plugins. Besides Weka, Mahout is also a great Java framework for machine learning provided in Hadoop that you can learn on your own. If you are a newcomer to machine learning and big data, then persist in learning Weka and wholeheartedly learn one library.
6. NanoCubes
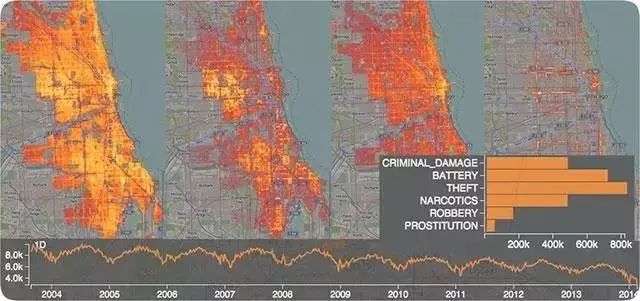 If you need to analyze spatiotemporal data exceeding tens of millions, such as the time and geographic distribution of billions of users’ posts on Weibo (from province to street multi-level granularity exploration), NanoCubes is recommended (http://www.nanocubes.net/). This open-source software can provide rapid display and multi-level real-time drilling exploratory analysis of hundreds of millions of spatiotemporal data on regular office computers. The above image is an analysis of crime time and location in Chicago, and the website has more real-time analysis demonstration examples.
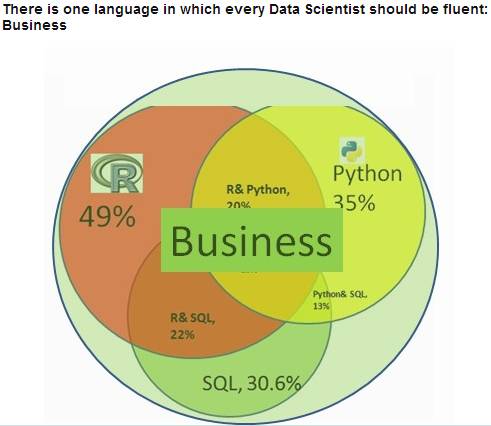
7. Advanced Programming Usage

◆ R language—most suitable for individuals with a statistical research background, with a rich library of statistical analysis functions and visual plotting functions that can be called directly. Through Hadoop-R, it can also support processing of data at the hundred billion level. Compared to SAS, it has stronger computational capabilities and can solve more complex and larger data scale problems.
◆ Python language—the biggest advantage is in text processing and handling large data volumes, and it is easy to develop. In the field of related analysis, Python’s momentum to replace R is becoming increasingly evident.
◆ Java language—a general-purpose programming language with the most comprehensive capabilities, possessing the most open-source big data processing resources (statistics, machine learning, NLP, etc.) available for direct use. It is also supported by all distributed computing frameworks (Hadoop/Spark).
Conclusion

From a temporal perspective, machine learning is about using the past to predict the future.
From the perspective of information flow processing, machine learning is about compressing and extracting information according to certain rules.
From the perspective of neuron parameters, the process of machine learning is about establishing connections between neurons, where patterns that frequently appear in the learning samples will establish strong associations, while patterns that appear less frequently will have weaker associations.
From an academic perspective, machine learning is about spatial search and generalization of functions.
From an application perspective, machine learning can be roughly explained as data mining + artificial intelligence.
From a philosophical perspective, machine learning is about “reproducing the process by which humans understand the world.
As for ordinary people and architects, machine learning is a future essential tool. Just as we viewed AutoCAD in the 1990s, we now look at BIM. One day, the handling of complex architectural factors and parts of the complicated design process in our work will be replaced by self-optimizing algorithms and artificial intelligence based on machine learning. At that time, as architects, we should be the masters of these tools, not obsolete products. The wave of artificial intelligence is approaching, and that day should not be too far away. Are you ready?
Further Reading:
Regression Methods
http://www.csdn.net/article/2015-08-19/2825492
Andrew Ng, CS229, Stanford University Machine Learning Videos,
http://open.163.com/special/opencourse/machinelearning.html
CS229 Study Notes
http://www.cnblogs.com/xuesong/p/4094968.html
List of Learning Resources
http://conductrics.com/data-science-resources/
Understanding machine learning algorithms from scratch: book recommendations and overcoming obstacles
http://www.csdn.net/article/2015-09-08/2825646
Compiled from:
http://cs229.stanford.edu/
http://www.sas.com/en_id/insights/analytics/machine-learning.html
http://blog.chinaunix.net/uid-25267728-id-4678802.html
http://www.cnblogs.com/xiaowanyer/p/3701944.html
https://www.zhihu.com/question/19830921
http://machinelearningmastery.com/a-tour-of-machine-learning-algorithms/
http://mp.weixin.qq.com/s?__biz=MzA4MzQxMTAwNA==&mid=2650108926&idx=3&sn=9a274344c5fa7d78cb69c467707af178&scene=2&srcid=0913CnGmnfggd2s97NVeGNLA&from=timeline&isappinstalled=0#wechat_redirect
Hu Yuchen, Master’s Student at the College of Architecture and Urban Planning, Tongji University
Source: FabUnion
Recent Popular Articles Top 10
↓ Click the title to view ↓
1. “What does ‘Mozi’ want to do in the sky? Understand with one picture
2. 12 most controversial mathematical facts (multiple images)
3. Finally, someone explained what a chip is
4. A wave of dynamic diagrams of fiber optic communication principles, beautiful!
5. Research funding liberation!!!
6. If GPS and Beidou are both “taken down,” would you still dare to use navigation?
7. Qixi Special Planning | Couples Academicians, Deep Affection
8. Rarely seen! The beauty of chemical structures exceeds your imagination
9. How great is the physical possibility of