The scale and speed of data and information generation today make it difficult for organizations to effectively extract valuable insights frommassive information and diverse sources. We rely on Google, Amazon, Alexa, and other chatbots because they help us find information and take action in ways that align with how we typically think.
1
1. Limited understanding of business applications and use cases, which makes it hard to defineclear visions and strategies. 2. Not knowing where to start when selecting the most relevant and cost-effective business use cases and supporting rapid validation with business or functional teams,3. Multiple initiatives across the organization are not streamlined or optimized for the enterprise. 4. Enterprise data and information aredifferent, redundant, and not easily usable. 5. Lack of necessary skills and training.
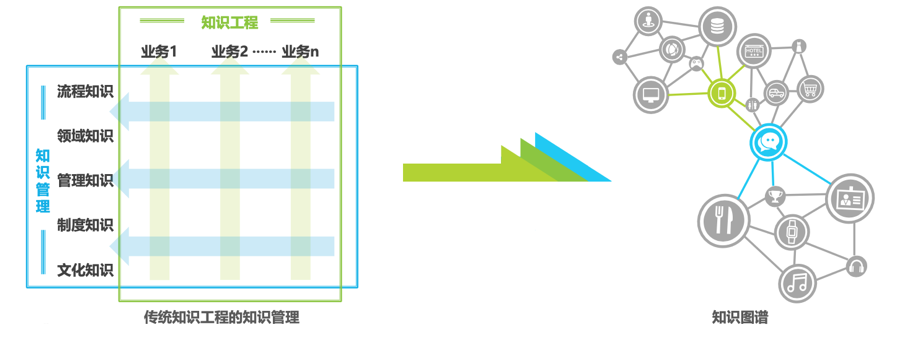
Currently, most enterprises are developing or utilizingknowledge graphs to enhance their knowledge, data, and information management. Typically, these functions belong to existing roles or functions within the organization, such as data science or engineering, business analysis, information management, or data operations.
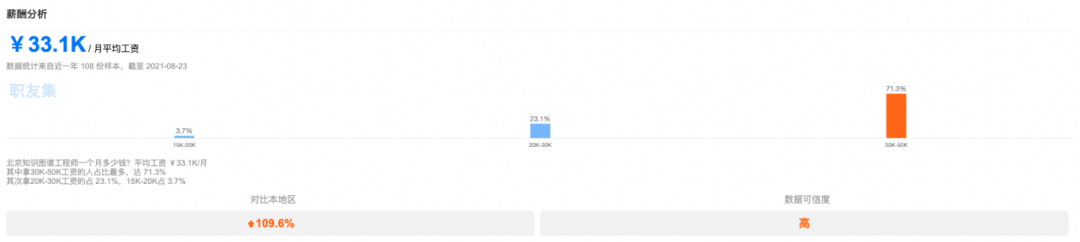
The application fields of knowledge graphs are very broad, and more importantly, knowledge graphs are the ultimate linking engine for enterprise data management and also the driving force for new methods in artificial intelligence. So engineers, do you want to know what the salary of a knowledge graph engineer is?
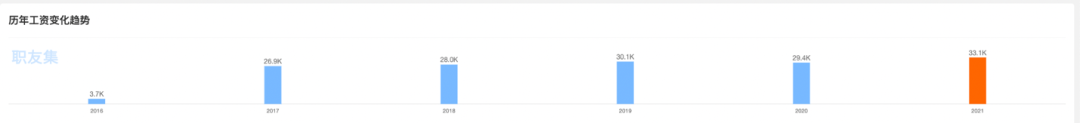
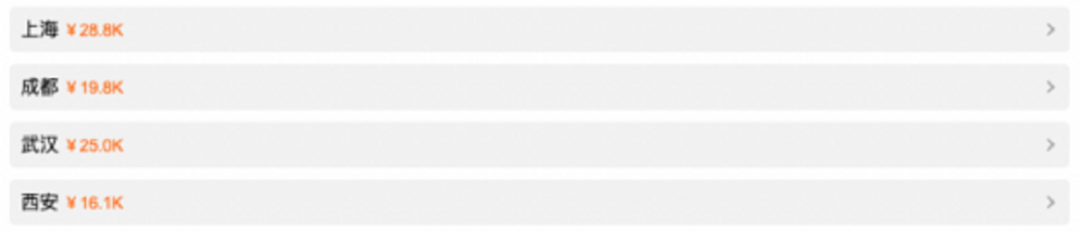
Looking at the changes in salary data over the years, from 2016 to 2021 the salary of knowledge graph engineers has been on the rise, and with the explosion of knowledge graph applications in various fields, the future salaries of knowledge graph engineers will continue to rise, making it a highly competitive position.
Knowledge graph engineers in various regions earn significantly more than the average salary in their cities, proving that both the nation and enterprises are beginning to focus on the future applications of knowledge graphs, and that this field will have limitless development directions.
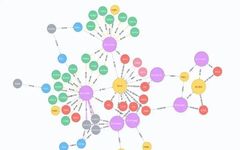
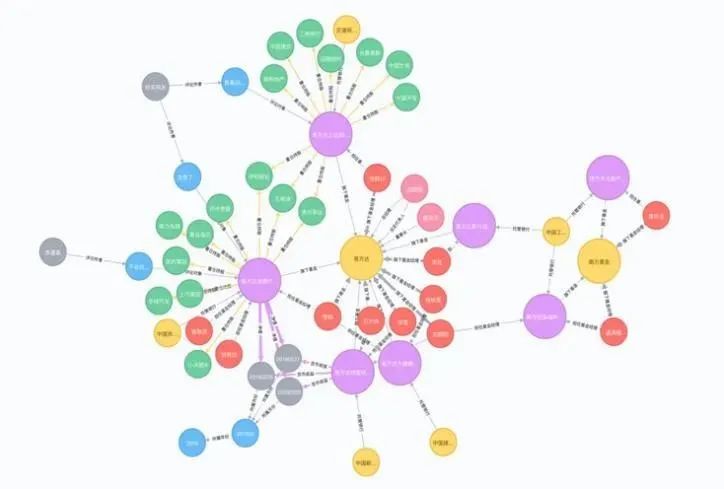
A knowledge graph is a large-scale semantic network that describes knowledge and models the relationships between all things in the world using graph models, and is one of the important ways of knowledge representation in the era of big data.
Knowledge graphs are all around you, and their application fields can be divided into four aspects: Good Governance, Benefit to the People, Industry Prosperity, and Intelligent Integration.
Good Governance
Urban Governance: Knowledge graphs empower smart public management systems in cities, creating a digital brain for urban areas.
Environmental Protection: Building an ecological environment knowledge base, forming a unified environmental data standard.
Benefit to the People
Healthcare: Providing knowledge services in areas such as medical guidance, auxiliary diagnosis, and pharmaceutical market expansion.
Educational Knowledge: Integrating educational knowledge graphs with machine learning algorithms to achieve intelligent adaptive education.
Industry Prosperity
Smart Buildings: Creating knowledge graphs in the construction industry primarily based on BIM data and standards.
General Business Management: Efficiently achieving the creation, accumulation, and utilization of knowledge resources within enterprise knowledge management platforms.
General Manufacturing: Modeling basic data to achieve multi-faceted coordination and control throughout the entire manufacturing process.
Intelligent Integration
Intelligent Risk Control and Credit Assessment: Combining knowledge graphs with machine learning to reshape the intelligent risk control process in finance.
Intelligent Investment Research Advisor: Solving pain points in the investment research field through automated data collection and industrial chain relationship reasoning.
Intelligent Product Marketing: Building multi-dimensional customer profiles with knowledge graphs to achieve precise personalized recommendations.
The core of knowledge graphs is their ability to coordinate and link structured and unstructured data, resulting in higher data quality, making them very suitable for machine learning. By using knowledge graphs, one can benefit from precise search and analysis, semantic data cataloging, deep text analysis, agile data integration, and other applications.
Note
1
Clarify Business and Expert Requirements: Determine the goals for data collection and define the questions to be answered.
2
Collect and Analyze Relevant Data: Discover which datasets, taxonomies, and other information (proprietary, open, or commercially available) best meet the goals in terms of domain, scope, source, maintenance, etc.
3
Clean Data to Ensure Quality: Correct any data quality issues to make the data fit for purpose. This includes removing invalid or meaningless entries, adjusting data fields to accommodate multiple values, fixing inconsistencies, etc.
4
Create a Semantic Data Model: Thoroughly analyze different data schemas to prepare for data coordination. Reuse or design ontologies, application profiles, RDF shapes, or other mechanisms on how to use them together. Use standard forms such as RDF Schema and OWL to formalize the data model.
5
Integrate Data with ETL or Virtualization: Apply ETL tools to transform data into RDF or use data virtualization techniques like NoETL, OBDA, GraphQL Federation to access it. Generate semantic metadata to make data easier to update, discover, and reuse.
6
Coordinate Data through Alignment, Fusion, and Matching: Match descriptions of the same entities in overlapping datasets, process their attributes to merge information, and map their different taxonomies.
7
Build a Data Management and Search Layer: Perfectly merge different graphs using the RDF data model. For locally stored data, GraphDB™ can effectively enforce the semantic of the data model through inference, consistency checking, and validation. It can scale in clusters and synchronize with Elasticsearch and other search engines to meet expected usage and performance requirements.
8
Augment the Graph through Reasoning, Analysis, and Text Analysis: Enrich data by extracting new entities and relationships from text. Apply reasoning and graph analysis to discover new information. Now the data contained in the graph exceeds the sum of its constituent datasets. It also has better interconnectivity, leading to more content and deeper analysis.
9
Maximize Data Availability: Start providing answers to original questions through various knowledge discovery tools (such as powerful SPARQL queries, user-friendly GraphQL interfaces, semantic search, faceted search, data visualization, etc.). Additionally, ensure that data is FAIR (findable, accessible, interoperable, and reusable).
10
Make KG Easy to Maintain and Develop: Finally, after creating the knowledge graph and people start using it, keep it alive by setting up maintenance procedures—its development and updates from different sources will be consumed while maintaining high data quality.
(Source: Big Data DT)
Note: This article is copyrighted by the original author and source. If there are any copyright issues, please contact us promptly, and we will immediately correct or delete the relevant content.