

Monitoring the depth of anesthesia (DoA) during surgery is crucial, particularly non-invasive monitoring techniques. This article proposes a new approach for monitoring DoA, which utilizes time-frequency analysis of electroencephalogram (EEG) signals and extracts features from the gray level co-occurrence matrix (GLCM). First, the time-frequency map (TFM) of each EEG channel is computed using the smoothed pseudo-Wigner-Ville distribution (SPWVD). This study recorded EEG signals from 15 channels. Subsequently, the GLCM is used to obtain information from the TFM, resulting in four features: homogeneity, correlation, energy, and contrast. Finally, effective features are selected using the minimum redundancy maximum relevance (MRMR) method, and the nearest neighbor algorithm (KNN) classifier is employed to determine DoA. Based on the Bispectral Index (BIS), the EEG states are classified into deep sedation, surgical anesthesia, and awake sedation states. Data augmentation techniques are also used to enhance the training phase and improve accuracy. The accuracy of this method and the confusion matrix are obtained. The impacts of GLCM gray levels, KNN distance measurements, and data augmentation parameters on the effectiveness of this method are analyzed. The results demonstrate the effectiveness of this method in determining intraoperative DoA.
Introduction
Many surgical procedures require general anesthesia (GA). Patients under GA exhibit the following characteristics: loss of consciousness, lack of response to painful stimuli, amnesia, and inability to move. Insufficient anesthesia can lead to the patient regaining consciousness, which is why anesthesiologists often monitor the depth of anesthesia (DoA) using various indicators. Monitoring DoA primarily involves observing the progressive central nervous system suppression and the reduction of the patient’s responsiveness to stimuli.
The most frightening complication of anesthesia for patients is intraoperative awareness. This can lead to long-term psychological issues post-surgery, such as post-traumatic irritability, tension, and anxiety. Monitoring DoA can prevent the occurrence of intraoperative awareness. By accurately controlling the dosage of anesthetic agents, anesthesia that is too deep or too shallow can be avoided, thereby improving patient outcomes, and accurate assessment of DoA can achieve this goal.
There are many methods and devices for monitoring DoA. Most of these devices are based on clinical/routine monitoring and/or brain activity, with each monitoring method having its drawbacks. Research indicates that since the central nervous system is the ultimate target for general anesthetics, EEG signals better reflect the depth of anesthesia. BIS, auditory evoked potentials (AEP), entropy, and narcotrend are some commercial DoA monitoring devices based on EEG. However, these monitoring methods are not entirely accurate and have some limitations.
Recently, several studies have aimed to introduce new methods for measuring DoA. One article employed Bayesian techniques to evaluate DoA, which considered the limited large sample normal distribution, with the maximum a posteriori (MAP) value gradually increasing as the anesthetic state changes from awake to light, moderate, and deep anesthesia. Another study focused on distinguishing between awake and anesthetized states using EEG signals, extracting 11 features such as entropy and spectral signals, and subsequently extracting effective information. Order entropy, sample entropy, beta-index, and detrended fluctuation analysis used a language fuzzy constrained adaptive neuro-fuzzy inference classifier to achieve optimal accuracy. Another article used EEG quasi-periodicities to analyze variations in DoA, employing the phase rectified signal averaging method. The results indicated that this method performed better than sample entropy and order entropy.
Another article extracted six features from EEG signals, including ratios, spectral edge frequency, and four spectral energy bands, and then used a decision tree classifier to determine DoA. The authors categorized DoA into four states: deep, moderate, and light anesthesia, as well as an awake state. First, the Hurst method was used to denoise the EEG signals, and the maximum range of the Hurst was taken as the brain response. The results showed that the maximum power spectral density (PSD) could describe different transitions in DoA states. The EEG signals were decomposed using atomic decomposition. Features were extracted from the decomposed sub-bands, and a support vector machine (SVM) classifier was used to distinguish between awake and sedated states.
Additionally, near-infrared spectroscopy (NIRS) signals have been used to record cerebral hemodynamic changes for monitoring DoA. This article suggested measuring sample entropy to describe the complexity of cerebral hemodynamic variables. A multimodal system, which uses both EEG and NIRS signals simultaneously to monitor DoA, can also be employed. By using EEG + NIRS signals, transitions from awake to deep anesthesia can be detected, which BIS cannot identify.
Other methods include using order power spectral density (O-PSD) to measure DoA. Deep neural networks (DNN) AnesNet can quantify DoA. Convolutional neural networks (CNN) can convolve, pool, and fully connect raw EEG signals to determine DoA. Short-time Fourier transform (STFT) can obtain PSD, and CNN determines DoA based on the obtained PSD. Wavelet transform can be used to analyze DoA in EEG signals. For this purpose, the extracted features are clustered using a wavelet-based classifier. Simultaneously, feature vectors are used to extract EEG signals during the auditory evoked potential under anesthesia.
Due to the nonlinear characteristics of EEG signals under anesthesia, this article employs time-frequency analysis of EEG to monitor DoA. The SPWVD is used to obtain a segment of the EEG’s time-frequency map (TFM). To obtain features from the TFM, four features are extracted using the gray level co-occurrence matrix (GLCM); since these extracted features do not contain rich information, effective features are selected through MRMR. Finally, KNN is used to determine DoA. Therefore, the key points of this study can be summarized as follows:
(i) Obtaining the TFM of EEG using SPWVD
(ii) Using GLCM characteristics to describe time-frequency content
(iii) Utilizing MRMR algorithm to select features to reduce classification complexity
(iv) Applying data augmentation functions to increase the generalizability of the KNN classifier
(v) Obtaining the accuracy and confusion matrix of this method
(vi) Analyzing the precision of different distance measurements and varying gray levels and augmentation parameters
Data
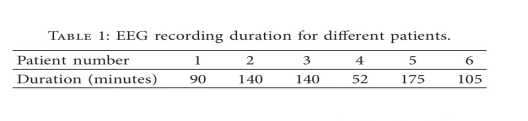
Six female patients participated in the experiment, aged between 26-72 years, with an average age of 45.5 years. These patients were all elective gynecological surgery patients, classified as ASA I or II. A 5-minute EEG was recorded preoperatively. After the patients entered the operating room, recording of BIS began before the surgery commenced. EEG was recorded during the maintenance and awakening phases of anesthesia, with a long segment of EEG recorded from 10 minutes before the end of anesthesia to awakening. Table 1 shows the duration of EEG recorded for the six patients during surgery.
According to the international 10-20 system, EEG signals from 15 channels were recorded, while BIS was recorded as a reference. The BIS index ranges from 0-100, with 0 indicating complete cortical suppression and 100 indicating an awake state. A BIS of 40-60 is suitable for surgical anesthesia depth.
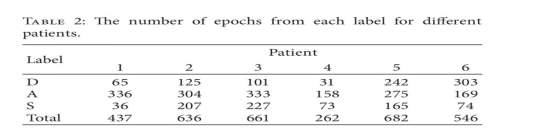
The EEG signals were segmented into 30-second segments with 50% overlap. The average BIS value for each segment was calculated, labeled as: deep sedation (D), surgical anesthesia (A), and awake sedation (S) states, with BIS less than 40 marked as D, between 40 and 60 as A, and greater than 60 as S. Table 2 records the number of segments marked for each of the six patients.
DoA Monitoring
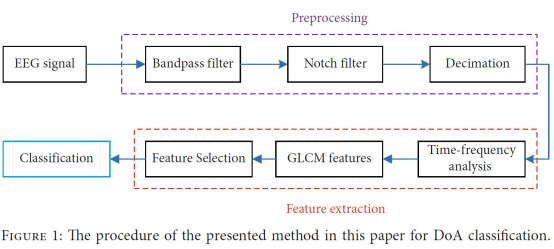
The process of this scheme is shown in Figure 1. As illustrated, this scheme generally determines DoA through three steps: preprocessing, feature extraction selection, and classification.
Results
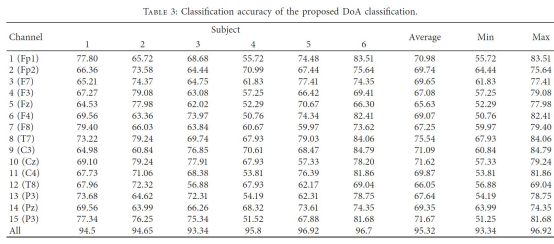
Table 3 shows that the selection of channels significantly impacts accuracy. Channel T7 has the best average accuracy at 75.54%, while channel Fz has the lowest average accuracy at 65.63%. Subjects 3 and 5 have the lowest and highest accuracy results, respectively, at 93.34% and 96.92%. These results demonstrate the effectiveness of using this method to classify EEG signals for monitoring DoA.
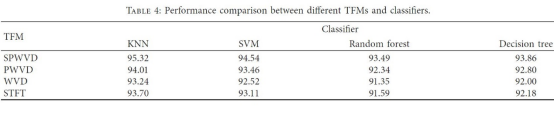
Table 4 compares the performance of various TFMs and classifiers. SPWVD, WVD, and STFT were used alongside KNN, SVM, random forests, and decision tree classification methods. SPWVD and KNN pairing outperformed other pairing methods. For all TFMs, KNN provided the best accuracy, while SVM yielded good performance. Among the TFMs, SPWVD and WVD had the best and lowest accuracy, respectively.
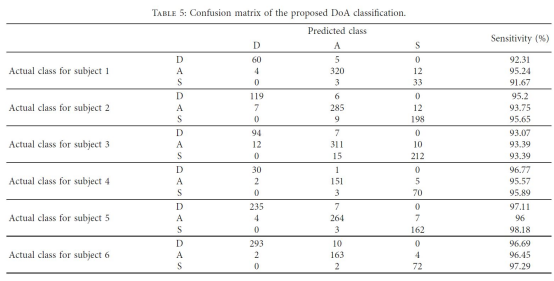
Table 5 displays the confusion matrix for DoA classification among different subjects.
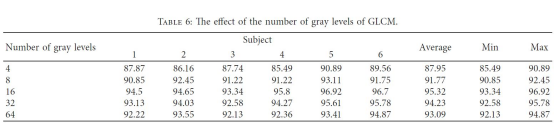
Table 6 shows the effect of the number of gray levels when calculating GLCM. It can be seen that as the gray levels increase from 4 to 16, accuracy gradually increases; however, when gray levels increase from 16 to 64, accuracy decreases. Therefore, the gray levels should be set at 16 for extracting structure-based features from the TFM obtained by SPWVD.
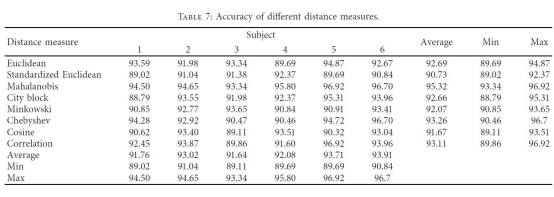
Table 7 presents the accuracy when different distance measurements are employed in the KNN classifier. The Mahalanobis distance has the highest accuracy at 95.32%, followed by the Chebyshev distance at 93.26%. The standard Euclidean distance has the lowest accuracy at 90.73%.
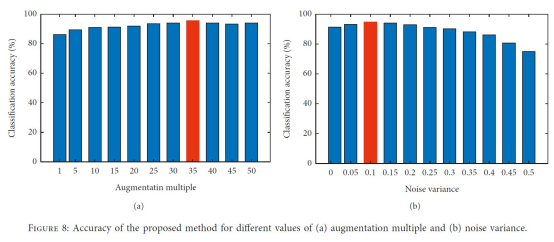
Figure 8 shows the effect of the augmentation multiplier and noise variance on DoA classification in data augmentation. In (a), it can be seen that as the augmentation multiplier increases from 1 to 35, accuracy increases; however, afterward, accuracy decreases. Therefore, the augmentation multiplier should be set at 35. In (b), as noise variance increases from 0 to 0.1, accuracy increases, but afterwards, accuracy decreases; thus, the variance should be set at 0.1.
Conclusion
This article presents a non-invasive method for monitoring DoA, based on time-frequency analysis of EEG from 15 channels. The TFM for each channel is computed using SPWVD. GLCM is used to describe the gray content of each TFM. The MRMR algorithm is employed to eliminate redundant features, and KNN is used to classify effective features to determine DoA. The results show that using 16 gray levels and Mahalanobis distance yields an average accuracy of 95.32%, indicating its effectiveness. The best accuracy is achieved with augmentation multipliers and noise variance set to 35 and 0.1, respectively.
Future work may apply deep learning and transfer learning methods. By employing convolutional neural networks (CNNs) for TFM classification through time-frequency analysis. From a time series analysis perspective, long short-term memory networks (LSTMs) can be utilized to determine DoA.
Review:
The depth of anesthesia is closely related to perioperative complications, and maintaining an appropriate depth of anesthesia during surgery aids in the early recovery of patients. However, unlike blood pressure and heart rate, there is no clear numerical value for depth of anesthesia, and how to quantify it has been a topic of ongoing exploration.
The human brain’s neural activity reflected in EEG is a complex activity characterized by nonlinear dynamics. In anesthesia, nonlinear dynamics have become an important reference standard for assessing anesthetic states. Among them, entropy-based EEG analysis methods have been applied in clinical practice for monitoring depth of anesthesia. This article employs some machine learning methods to extract brain states from time-frequency analysis of EEG signals to monitor DoA.
With the continuous advancement of algorithms, future use of deep learning algorithms for EEG analysis may have certain advantages: first, features can be learned directly from raw data through multiple layers, considering higher-order features and the relationships between these features; second, unsupervised learning methods can be used to analyze unlabeled data, which has broader applications for large amounts of unlabeled EEG data.
An ideal depth of anesthesia monitor must meet many conditions: (1) it can accurately monitor the depth of anesthesia regardless of changes in anesthetic concentration and correlate well with clinical sedation performance; (2) the data is accurate and reliable, with high temporal resolution; (3) it can classify anesthesia across a reasonable scale for all anesthetics; (4) it can provide decision-making assistance for clinicians; (5) it has strong electromagnetic interference resistance; (6) it is economical and convenient to use. Therefore, further research and improvement of the analytical methods used for depth of anesthesia monitoring are needed to obtain a more comprehensive composite index.
Original link:
Mousavi SM, Asgharzadeh-Bonab A, Ranjbarzadeh R. Time-Frequency Analysis of EEG Signals and GLCM Features for Depth of Anesthesia Monitoring. Comput Intell Neurosci. 2021 Aug 11;2021:8430565.