
Introduction
At the invitation of the “Cloud Technology Community“, I decided to write something. After much thought, I realized that the field of cloud computing is vast, so I will talk about a recent hot topic that deeply resonates with many cloud computing practitioners: the challenging yet beloved OpenStack.
Here, I will share my insights on the OpenStack cloud platform from a technical perspective, discussing aspects such as deployment, architecture, and operational implementation.
The journey began in 2014 when I first encountered OpenStack in my sophomore year. At that time, resources both domestically and internationally were nowhere near as abundant as they are today. It took me more than a week just to install an OpenStack H version environment (using VMware Workstation to virtualize 2 virtual machines on a single laptop), and I ultimately failed to create the virtual machines. Later, to learn OpenStack, I purposely went to Shanghai for an internship close to graduation, and before I knew it, four years had passed.
OpenStack encompasses a vast array of components: computing, storage, networking, architecture, products, operations, monitoring, performance optimization, code, and more. Here, I will express my understanding of OpenStack based on my four years of experience, as a way to summarize my journey. Please feel free to critique any inaccuracies.
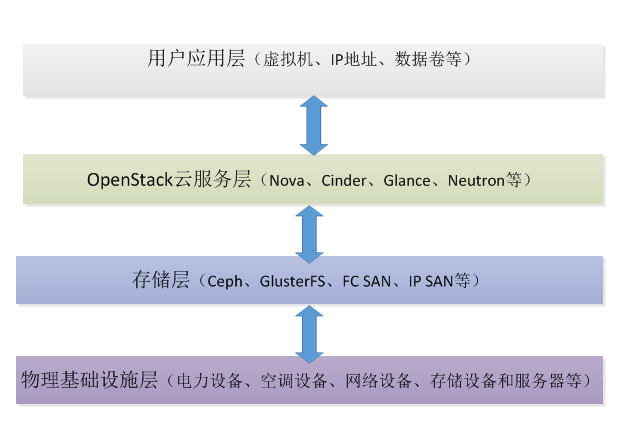
Indeed, a well-designed architecture and operational safeguards can have an immeasurable positive impact on the stable and healthy operation of the OpenStack cloud platform. To simplify, deploying a production-level OpenStack cloud platform involves at least four layers: physical infrastructure layer, storage layer, OpenStack cloud service layer, and user application layer, as shown in the figure below.
Physical Infrastructure Layer
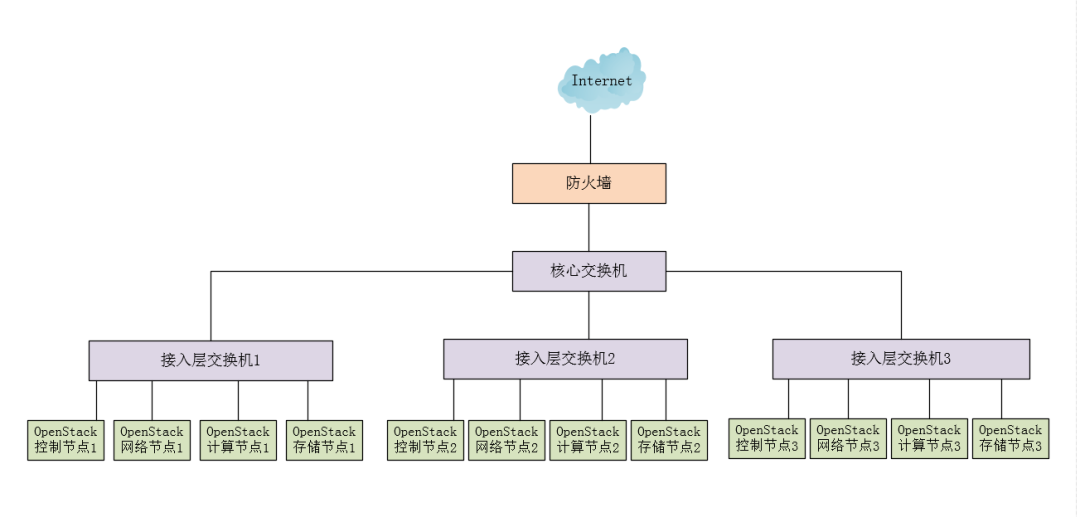
First, let’s start from the bottom layer, the “Physical Infrastructure Layer”. A basic physical infrastructure IT environment includes power equipment, air conditioning, fire protection equipment, networking devices (such as switches, routers, firewalls, load balancers, etc.), storage devices, and servers. Due to limitations in professional knowledge, I will only cover switches and servers here. A basic physical IT environment is shown in the figure below.
Switch Equipment
Generally, in an OpenStack production environment, switch ports should be aggregated (channel). This means combining two or more physical ports into a single logical link to increase bandwidth between the switch and network nodes, merging the bandwidth of these ports to provide a high bandwidth that is several times greater than that of individual ports. A Trunk is a type of encapsulation technology that represents a point-to-point link, where both ends can be switches, or a switch and a router, or a host and a switch or router.
Servers
The network types involved in the OpenStack cloud platform include management network (for communication between OpenStack services), external network (providing floating IPs), storage network (such as Ceph storage network), and virtual machine network (also known as tenant network or business network).
For each type of network, the server should implement NIC bonding to provide redundancy, high availability, and load balancing capabilities based on actual needs, choosing either mode 0 or mode 1. Bond mode 0 is recommended in scenarios with high network traffic; bond mode 1 is recommended in scenarios with higher reliability requirements.
Comparison of the two.

In general, in small-scale private cloud environments, the bandwidth corresponding to each network type is:
• Management Network: Gigabit Network
• External Network: Gigabit Network
• Storage Network: 10 Gigabit Network
• Tenant Network: Gigabit Network
If it is a medium to large-scale private cloud or public cloud environment, it is recommended to use 10 Gigabit networks wherever possible.
Hard Disk
The system disk used by the server’s operating system should use two hard disks to implement RAID 1 for high reliability of system storage. It is recommended to use high-performance and cost-effective SAS hard drives to improve the IO storage performance of the operating system, MySQL database, and Docker containers (if deploying OpenStack with Kolla).
CPU
The CPU models of all compute nodes in OpenStack must be consistent to ensure the normal availability of virtual machine migration functions.
Memory
The memory size of all compute nodes in OpenStack should be consistent to ensure balanced scheduling of virtual machine creation and management. Additionally, the host’s swap partition should be set scientifically and reasonably, rather than using the system’s default settings.
A few machines in the data center are used as control nodes, while most machines need to run virtualization software. The virtualization platform will have a large number of VMs, and the host system itself will also run some services. This will inevitably lead to resource contention between VMs and between VMs and the host system. We need to set rules to allow them to run efficiently within their respective boundaries, minimizing conflicts and contention.
We can allow the host operating system to select specific cores, thereby minimizing contention for vCPU scheduling in virtualization. By modifying kernel boot parameters, we can achieve:
Modify the /etc/default/grub file to let the system use only the first three cores, isolating the remaining cores.
GRUB_CMDLINE_LINUX_DEFAULT=”isolcpus=4,5,6,7,8,9,10,11,12,13,14,15,16,17,18,19,20,21,22,23,24,25,26,27,28,29,30,31″
Update kernel parameters
# update-grub
# reboot
In terms of memory configuration, the practice of NetEase’s private cloud is to disable KVM memory sharing and enable transparent huge pages:
echo 0 > /sys/kernel/mm/ksm/pages_shared
echo 0 > /sys/kernel/mm/ksm/pages_sharing
echo always > /sys/kernel/mm/transparent_hugepage/enabled
echo never > /sys/kernel/mm/transparent_hugepage/defrag
echo 0 > /sys/kernel/mm/transparent_hugepage/khugepaged/defrag
According to reports, after testing with SPEC CPU2006, these configurations can improve cloud host CPU performance by about 7%.
OpenStack Cloud Platform Layer
High Availability (HA) of the Cloud Platform
Introduction to High Availability (HA)
High availability refers to the ability to continue accessing applications in the event of a failure of a single component in the local system, regardless of whether the failure is due to business processes, physical infrastructure, or IT software/hardware failures. The best availability is when one machine goes down, but users utilizing your service do not feel it at all. When your machine goes down, the services running on that machine must perform a failover, which incurs costs in two dimensions: RTO (Recovery Time Objective) and RPO (Recovery Point Objective). RTO is the time it takes to recover the service; the best case is 0, meaning the service recovers immediately; the worst case is infinite, meaning the service can never recover; RPO is the length of time of data recovery to a point in time, where 0 means using synchronized data, and greater than 0 means data loss, for example, “RPO = 1 day” means that the data used for recovery is from one day ago, resulting in data loss within that day. Therefore, the best outcome for recovery is RTO = RPO = 0, but that is too idealistic, or the cost of achieving it is too high.
For HA, distributed storage is often used, which gives RPO = 0; at the same time, an Active/Active (dual-active cluster) HA mode is used to make RTO nearly 0. If using Active/Passive HA mode, RTO must be minimized. The formula for HA is [1 – (downtime)/(downtime + uptime)], and we often use several nines to express availability:
• 2 nines: 99% = 1% 365 = 3.65 24 hours/year = 87.6 hours/year of downtime
• 4 nines: 99.99% = 0.01% 365 24 * 60 = 52.56 minutes/year
• 5 nines: 99.999% = 0.001% * 365 = 5.265 minutes/year of downtime, meaning each downtime lasts one to two minutes.
• 11 nines: several minutes of downtime in years.
Classification of Services
HA classifies services into two categories:
• Stateful services: Subsequent requests to the service depend on previous requests. Stateful services in OpenStack include MySQL databases and AMQP message queues. For HA of stateful services, such as neutron-l3-agent, neutron-metadata-agent, nova-compute, cinder-volume, etc., the simplest method is multi-node deployment. For example, if the nova-compute service on a certain node goes down, it will not affect the entire cloud platform’s ability to create virtual machines, nor will the virtual machines on that node be unusable (e.g., SSH, etc.).
• Stateless services: Requests to the service are independent of each other, based entirely on redundant instances and load balancing to achieve HA. Stateless services in OpenStack include nova-api, nova-conductor, glance-api, keystone-api, neutron-api, nova-scheduler, etc. Since API services are stateless, they naturally support Active/Active HA mode. Therefore, a common approach is to use keepalived + HAProxy.
Types of HA
HA requires redundant servers to form a cluster to run loads, including applications and services. This redundancy can also classify HA into two types:
• Active/Passive HA: This is primary-backup HA. In this configuration, the system uses primary and backup machines to provide services, with the system only providing services on the primary device. When the primary device fails, the service on the backup device is started to replace the service provided by the primary device. Typically, CRM software like Pacemaker can be used to control switching between primary and backup devices and provide a virtual IP for service.
• Active/Active HA: This is primary-primary HA, and in the case of multiple nodes, it becomes multi-master. In this configuration, the system runs the same load on all servers within the cluster. For example, updates to one instance are synchronized to all instances. This configuration often uses load balancing software like HAProxy to provide a virtual IP for services.
High Availability (HA) Architecture of OpenStack Cloud Environment
The cloud environment is a broad system that includes the infrastructure layer, OpenStack cloud platform service layer, virtual machines, and end-user application layer.
The HA of the cloud environment includes:
• HA of user applications
• HA of virtual machines
• HA of OpenStack cloud platform services
• HA of the infrastructure layer: power, air conditioning, fire protection facilities, networking devices (such as switches, routers), server devices, and storage devices, etc.
For OpenStack cloud platform services (such as nova-api, nova-scheduler, nova-compute, etc.), there are at least dozens, if not hundreds. If one service goes down, the corresponding functionality cannot be used normally. Therefore, ensuring the overall HA of the cloud environment becomes a top priority in architecture design and operations.
The HA architecture of OpenStack is shown in the figure below.
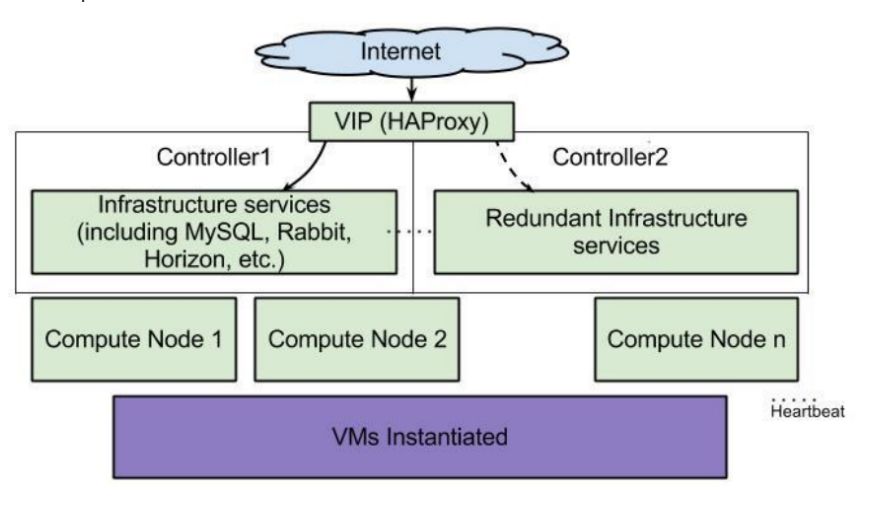
If we classify from the deployment level, the HA content of OpenStack includes:
• Control nodes (RabbitMQ, MariaDB, Keystone, nova-api, etc.)
• Network nodes (neutron_dhcp_agent, neutron_l3_agent, neutron_openvswitch_agent, etc.)
• Compute nodes (Nova-Compute, neutron_openvswitch_agent, virtual machines, etc.)
• Storage nodes (cinder-volume, swift, etc.)
Control Node HA
In a production environment, it is recommended to deploy at least three control nodes, while the rest can be compute nodes, network nodes, or storage nodes. Using HAProxy + KeepAlived, proxy database services and OpenStack services, exposing a VIP for API access.
MySQL Database HA
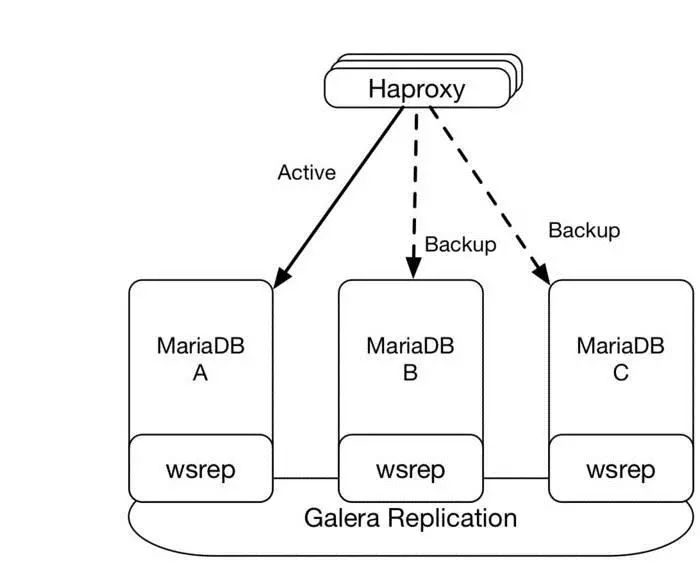
There are many HA solutions for MySQL; here we only discuss the MariaDB Galera cluster recommended by OpenStack. Galera Cluster is a system architecture that implements multi-master and real-time data synchronization on the InnoDB storage engine, eliminating the need for read-write separation at the business level, and distributing database read and write pressure to each node according to established rules. Its features include: 1) Synchronous replication, (>= 3) odd number of nodes; 2) Active-active multi-master topology; 3) Any node in the cluster can read and write; 4) Automatic identity control, failing nodes automatically detach from the cluster; 5) Automatic node access; 6) True row-level and ID-check based parallel replication; 7) No single point of failure, easy to expand.
Using the MariaDB + Galera scheme, at least three nodes should be deployed (the best number of nodes is odd), and external access is proxied via HAProxy’s active + backend method. Normally, the main database is A, and when A fails, it switches to node B or C. As shown in the figure below.
RabbitMQ Message Queue HA
RabbitMQ adopts a native cluster scheme where all nodes synchronize mirrored queues. In a small-scale environment, three physical machines are used, with two Mem nodes mainly providing services and one Disk node for message persistence. Clients can configure master-slave strategies based on their needs. It is said that using ZeroMQ instead of the default RabbitMQ can help improve cluster message queue performance.
OpenStack API Service HA
OpenStack’s control nodes primarily run stateless API services, such as nova-api, neutron-server, glance-registry, nova-novncproxy, keystone, etc. Therefore, HAProxy can be used for load balancing, routing requests to the API services on a specific node according to a certain algorithm, with KeepAlived providing the VIP.
Network Node HA
The Neutron services running on network nodes include many components, such as L3 Agent, Open vSwitch Agent, LBaaS, VPNaaS, FWaaS, Metadata Agent, etc., some of which provide native HA support.
• Open vSwitch Agent HA: The Open vSwitch agent only provides services on the network or compute node it resides on, so it does not require HA.
• L3 Agent HA: The two main solutions are VRRP and DVR.
• DHCP Agent HA: Deploy DHCP Agents on multiple network nodes to achieve HA.
• LBaaS Agent HA: Deploy A/P mode LBaaS Agent HA using Pacemaker + shared storage (place in /var/lib/neutron/lbaas/ directory).
Storage Node HA
The HA of storage nodes mainly targets the cinder-volume and cinder-backup services. The simplest method is to deploy multiple storage nodes so that if a service on one node fails, it does not impact the entire system.
Compute Node and VM HA
The community has been working on a unified VM HA solution since September 2016, but there is still no mature solution. To achieve HA for compute nodes and VMs, three main tasks need to be accomplished:
① Monitoring
Monitoring primarily involves two tasks: monitoring hardware and software failures of compute nodes and triggering fault handling events, i.e., isolation and recovery.
OpenStack compute node high availability can be achieved using Pacemaker and pacemaker_remote. By using pacemaker_remote, we can join all compute nodes into this cluster, with compute nodes needing only to install pacemaker_remote. The Pacemaker cluster will monitor whether the pacemaker_remote on the compute node is “alive”; you can define what “alive” means. For example, monitoring processes such as nova-compute, neutron-ovs-agent, libvirt on the compute node can determine whether the compute node is alive, or whether the tenant network and other networks are disconnected. If a problem is detected with a pacemaker_remote, subsequent isolation and recovery events can be triggered immediately.
② Isolation
The primary task of isolation is to remove the non-functional compute node from the OpenStack cluster environment, so the nova-scheduler will not send create_instance messages to that compute node.
Pacemaker has already integrated this functionality, allowing us to use fence_ipmilan to shut down the compute node. The pacemaker cluster will continuously monitor whether this compute node is down; nova can only execute host-evacuate to migrate VMs after the compute node is down, which may take some time. A better approach is to call the nova service-force-down command to mark the compute node as down, facilitating faster VM migration.
③ Recovery
Recovery involves migrating VMs from a compute node marked as down to other compute nodes. The Pacemaker cluster will call the host-evacuate API to migrate all VMs. The host-evacuate ultimately uses rebuild to migrate VMs, with each VM being scheduled to start on different compute nodes.
Of course, distributed health check services like Consul can also be used.
VM Operating System Fault Recovery
The libvirt/KVM driver in OpenStack has been able to automate the handling of these issues effectively. Specifically, you can add hw:watchdog_action to the extra_specs of a flavor or the properties of an image, and a watchdog device will be configured for the VM. If hw:watchdog_action is set to reset, the VM’s operating system will be automatically restarted if it crashes.
OpenStack Compute Resource Limits
Setting Memory
The memory allocation overcommit ratio defaults to 1.5 times; overcommitting is not recommended in production environments.
ram_allocation_ratio = 1
The reserved memory amount cannot be used by VMs to ensure the normal operation of the system.
reserved_host_memory_mb = 10240 // For example, reserve 10GB
Setting CPU
For virtualization resource utilization, we can control it through nova. OpenStack provides some configurations, modifying the nova.conf file. The binding range for VM vCPUs can prevent VMs from competing for CPU resources of the host process; the recommended value is to reserve the first few physical CPUs.
vcpu_pin_set = 4-31
The physical CPU overcommit ratio defaults to 16 times, counting hyper-threading as a physical CPU.
cpu_allocation_ratio = 8
Using Multiple Regions and AZs
If the OpenStack cloud platform needs to be deployed across data centers or regions, a multi-region and Availability Zone (AZ) strategy can be used. This way, each data center is naturally isolated geographically, providing a natural disaster recovery method for upper-layer applications.
Multi-region (Region) Deployment
OpenStack supports dividing into different Regions based on geographic locations. All Regions, except for shared Keystone and Horizon services, are complete OpenStack environments. Overall, deployments between multiple Regions are relatively independent but can communicate via internal leased lines (e.g., BGP-EVPN). The architecture is shown in the figure below.
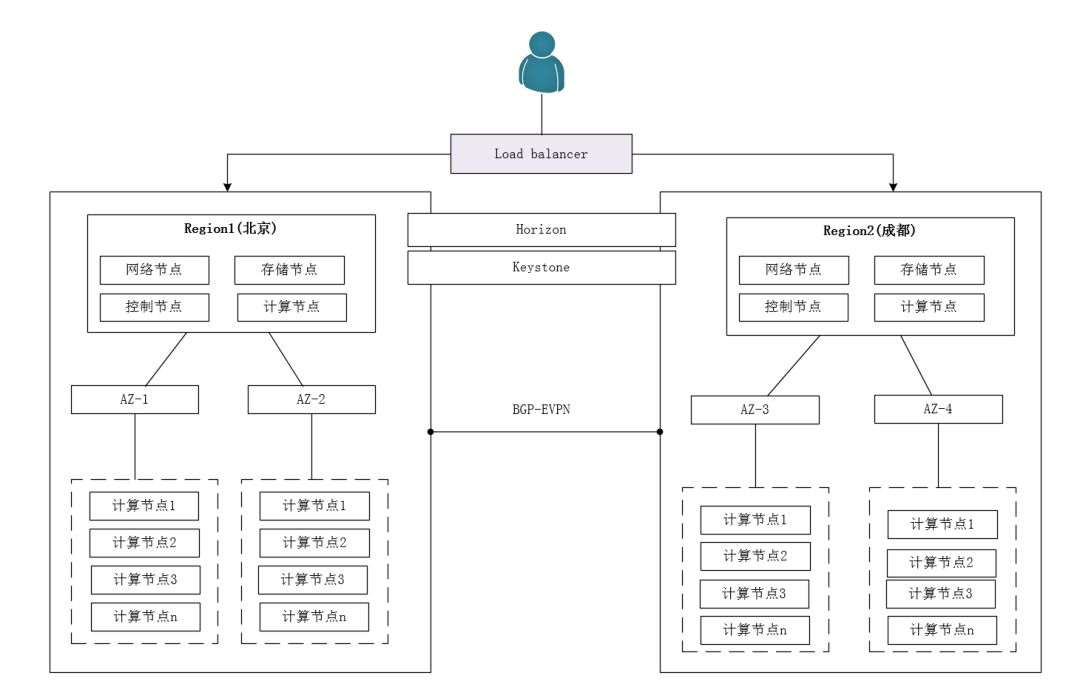
During deployment, only one set of public Keystone and Horizon services needs to be deployed, while other services can be deployed in a single Region manner, specifying the Region through the Endpoint. Users must specify a specific region when requesting any resources. This approach allows unified management of resources distributed across different regions, with each region potentially adopting a different deployment architecture or even different versions. Its advantages include:
• Simple deployment, with minimal additional configuration required for each region, and horizontal scaling is easily achievable.
• Fault domain isolation, where regions do not affect each other.
• Flexibility, where each region can use different architectures, storage, and networks.
However, this scheme also has significant drawbacks:
• Complete isolation between regions, where resources cannot be shared. For example, a volume created in Region A cannot be mounted to a VM in Region B. Resources in Region A cannot be allocated to Region B, potentially leading to unbalanced loads across regions.
• Complete independence between regions, with no support for cross-region migration. If a cluster in one region fails, VMs cannot evacuate to another region’s cluster.
• Keystone becomes a major performance bottleneck; its availability must be guaranteed, or it will affect services in all regions. This issue can be addressed by deploying multiple Keystone nodes.
The OpenStack multi-region solution unifies the management of large clusters by dividing them into smaller clusters, making it particularly suitable for scenarios that span multiple data centers and are distributed across different regions, such as Beijing and Shanghai. For users, it also offers the following benefits:
• Users can choose the region closest to them based on their location, reducing network latency and speeding up access.
• Users can implement disaster recovery between different Regions. When a significant failure occurs in one Region, they can quickly migrate their business to another Region.
Multi-Availability Zone Deployment
If the goal is to deploy the OpenStack cloud environment within a single data center, the AZ scheme is sufficient. Each AZ has its own independently powered rack, along with OpenStack compute nodes.
Availability Zone
A Region can be subdivided into one or more physically or logically isolated availability zones (AZ). When launching a virtual machine, you can specify a particular AZ or even a specific node within that AZ to start the VM. An AZ can be simply understood as a collection of nodes that share independent power supply devices, such as independently powered data centers or racks.
Then, multiple VMs of an application can be deployed across multiple AZs within a Region to enhance disaster recovery and availability. Since AZs are physically isolated, the failure of one AZ will not affect others. Additionally, VMs that were in a failed AZ can be migrated to other available AZs, similar to active-active disaster recovery.
Host Aggregate
In addition to AZs, compute nodes can also be logically grouped into Host Aggregates (HA). Host Aggregates use metadata to label groups of compute nodes. A compute node can belong to both a Host Aggregate and an AZ simultaneously without conflict, and it can also belong to multiple Host Aggregates.
Nodes in a Host Aggregate share common attributes, such as a group of nodes with a specific type of CPU, a group of nodes with SSD disks, or a group of nodes running Linux or Windows, etc. It is important to note that Host Aggregates are a concept invisible to users, primarily used by the nova-scheduler to schedule instances based on certain attributes, such as scheduling database service instances to a Host Aggregate with SSD attributes, or scheduling instances of a certain flavor or image to the same Host Aggregate.
In summary, the relationship between Region, Availability Zone, and Host Aggregate is hierarchical, where the former encompasses the latter. A geographic Region contains multiple AZs (availability zones), and compute nodes within the same AZ can be logically grouped based on certain rules. For example, there may be a Region in Beijing and a Region in Chengdu for disaster recovery purposes. Meanwhile, within the Beijing Region, there could be two AZs (such as the Jiuxianqiao data center and the Shijingshan data center), each with its own independent network and power supply devices, as well as OpenStack compute nodes. If a user is in Beijing, they can choose to deploy VMs in Beijing to improve access speed and achieve a better SLA (Service Level Agreement).
Selecting the Right Network Solution
Users often struggle with which network solution to use, such as VLAN, VXLAN, or GRE. The main difference between VLAN and VXLAN is that VLAN is a layer 2 network technology that does not require virtual routing conversion, offering relatively better performance than VXLAN and GRE, supporting up to 4094 networks, and simplifying architecture and operations. VXLAN, on the other hand, is an overlay network tunneling technology that encapsulates layer 2 data frames within layer 3 UDP packets for transmission, requiring routing conversion, encapsulation, and decapsulation, making it relatively less performant than VLAN, while its architecture is also more complex. However, it supports over 16 million networks and offers good scalability.
If enterprise users expect their cloud platform to remain small for an extended period (for instance, below 10,000 VMs) and do not have high requirements for multi-tenant network security isolation, then VLAN networking is a suitable choice. Conversely, if network security isolation is of utmost importance or if the cloud platform is very large, then the VXLAN networking solution should be adopted.
In the context of communication between VXLAN and VLAN networks, i.e., routing communication between tenant private networks and Floating IP external networks, in the traditional centralized routing environment of OpenStack, both north-south traffic and east-west traffic across networks must pass through the network node. As the scale of compute nodes increases, the network node quickly becomes the bottleneck of the entire system. To address this issue, the concept of Distributed Virtual Router (DVR) has been introduced. By using the DVR solution, routing can be distributed to compute nodes, allowing north-south traffic and east-west traffic between network segments to be routed by virtual routers on the compute nodes where the VMs reside, thus improving stability and performance.
Backing Up Cloud Platform Data
As the saying goes, having a backup allows for peaceful sleep. In a real environment, data deletion can occur for various reasons, such as databases, VMs, data volumes, images, or underlying storage being deleted in the cloud platform. If data is not backed up, the consequences can be disastrous.
In a cloud platform environment built with OpenStack + Ceph, there are numerous data backup solutions available. OpenStack has built-in cloud services like Karbor and Freezer, Ceph also has related backup solutions, and there are other commercial backup solutions as well. In fact, OpenStack provides several user-friendly backup features, such as VM snapshots/backups and data volume snapshots/backups. During usage, it is also encouraged to mount data volumes to VMs to write data to cloud disks, indirectly achieving data disaster recovery backups.
If, for some reason, there are no Regions and AZs across physical data centers or regions, then data backup related to the OpenStack cloud platform is essential. For instance, MySQL databases can be backed up every few hours based on actual needs. It is recommended to store the backup data on other machines. For the underlying storage backup solution of Ceph, the RBD Mirroring solution can be used.
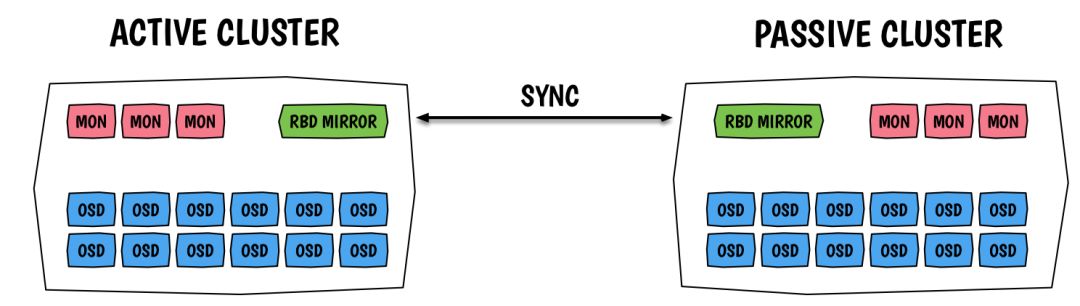
RBD Mirroring is a new asynchronous backup feature of Ceph, supporting the configuration of rbd synchronization between two Ceph Clusters. In this solution, the Master Cluster uses high-performance storage devices, which are provided to OpenStack’s Glance, Cinder (cinder-volume, cinder-backup), and Nova services; while the Backup Cluster uses larger capacity but cheaper storage devices (e.g., SATA drives) to back up Ceph data. Different Ceph Cluster clusters can be configured based on actual needs to determine whether to back up across physical data centers. As shown in the figure below.
Advantages:
• New feature of Ceph, requiring no additional development.
• The synchronization granularity is relatively small, at the transaction level of a block device.
• Ensures crash consistency.
• Configurable pool backups and individual image backups.
• Synchronous backups allow for cross-data center disaster recovery between Ceph clusters.
Using Appropriate Docker Storage
If the OpenStack cloud platform is deployed and managed using Kolla containers, then selecting the correct and appropriate Docker storage is crucial for the stability and performance of your platform.
Docker uses storage drivers to manage the content of each layer of images and the writable container layer. Storage drivers include devicemapper, aufs, overlay, overlay2, btrfs, zfs, etc. Different storage drivers have different implementation methods, and the organization of images may vary slightly, but they all use stack storage and employ Copy-on-Write (CoW) strategies. Additionally, storage drivers adopt hot-plug architecture, allowing for dynamic adjustments. So, with so many storage drivers available, how should one choose the right one? The following aspects should be considered:
• If the kernel supports multiple storage drivers and none are explicitly configured, Docker will choose based on its internal priority. The priority is aufs > btrfs/zfs > overlay2 > overlay > devicemapper. If using devicemapper, in production environments, always choose direct-lvm; loopback-lvm has very poor performance.
• The choice may be limited by the Docker version, operating system, and system version. For example, aufs can only be used on Ubuntu or Debian systems, while btrfs can only be used on SLES (SUSE Linux Enterprise Server, supported only by Docker EE).
• Some storage drivers depend on the underlying file systems. For example, btrfs can only run on the btrfs file system.
• Different storage drivers perform differently in different application scenarios. For instance, aufs, overlay, and overlay2 operate at the file level, using memory more efficiently, but when reading and writing large files, the container layer can become quite large; devicemapper, btrfs, and zfs operate at the block level, suitable for high write-load scenarios; when there are many container layers and frequent small file writes, overlay2 is more efficient than overlay; btrfs and zfs consume more memory.
Docker containers essentially add a writable layer on top of the image, often referred to as the container layer. All modifications made within a running container, such as writing new files, modifying existing files, or deleting files, are written to the container layer. The storage driver determines the storage method and organization of images and containers in the file system. In our production environment, we are using CentOS 7.4 and its 4.15 kernel version + Docker 1.13.1 version. Therefore, we are using the overlay2 storage driver. Below is a brief introduction to overlay2.
Overlay Introduction
OverlayFS is a union file system similar to AUFS, but with a simpler implementation and better performance. Strictly speaking, OverlayFS is a file system in the Linux kernel, with the corresponding Docker storage drivers being overlay or overlay2; overlay2 requires Linux kernel 4.0 and above, while overlay requires kernel 3.18 and above, and currently only the Docker community edition supports it. If conditions permit, it is advisable to use overlay2, as it has a higher inode utilization compared to overlay.
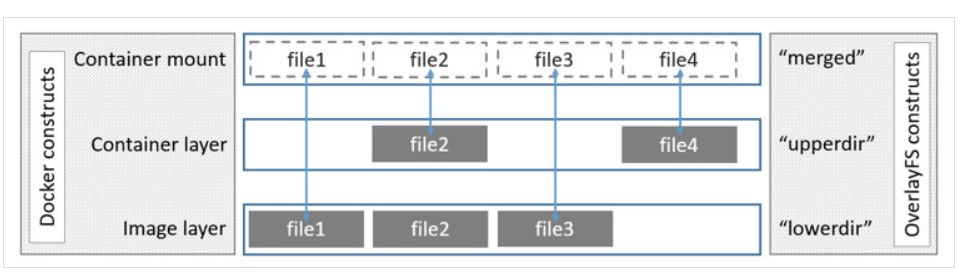
Unlike AUFS’s multiple layers, Overlay only has two layers: an upper file system and a lower file system, representing the Docker container layer and image layer, respectively. When a file needs to be modified, it uses CoW to copy the file from the read-only lower layer to the writable upper layer for modification, with the result saved in the upper layer. In Docker, the lower read-only layer is the image, while the writable layer is the container. The structure is illustrated in the figure below.
Analysis
• OverlayFS entered mainstream Linux kernels starting from kernel 3.18. Its design is simple and fast, outperforming both AUFS and Device mapper. In certain cases, it even outperforms Btrfs. It is the future of Docker storage choice. Because OverlayFS only has two layers rather than multiple layers, its “copy-up” operation is faster than AUFS, thus reducing operational latency.
• OverlayFS supports page cache sharing, allowing multiple containers accessing the same file to share a page cache, thereby improving memory utilization.
• OverlayFS consumes inodes; as images and containers increase, inodes may become a bottleneck. Overlay2 can solve this problem. Under Overlay, to address inode issues, one can consider mounting /var/lib/docker on a separate file system or increasing the system inode settings.
Using Distributed Storage
If the OpenStack cloud platform uses an open-source distributed storage system like Ceph or GlusterFS, ensuring the redundancy, reliability, security, and performance of the storage system becomes particularly important. Here, I will explain using Ceph open-source distributed storage as an example.
Deployment of Mon and OSD Nodes
In a production environment, at least three Ceph Mon nodes (preferably an odd number) and multiple OSD nodes should be deployed.
Enabling CephX Authentication
At the same time, enable CephX authentication to enhance data storage security and prevent attacks. As shown below.
# cat /etc/ceph/ceph.conf
[global]
fsid = e10d7336-23e8-4dac-a07a-d012d9208ae1
mon_initial_members = computer1, computer2, computer3
mon_host = 172.17.51.54,172.17.51.55,172.17.51.56
auth_cluster_required = cephx
auth_service_required = cephx
auth_client_required = cephx
………
Network Configuration
If the scale of Ceph storage nodes is small, the Ceph public network (Public Network) should use a Gigabit network, and the cluster network (Cluster Network) should use a 10 Gigabit network. If the scale of Ceph nodes is large and the business load is high, it is advisable to use 10 Gigabit networks wherever possible; in critical environments, both the Ceph public network and cluster network should be separated. It is important to note that the network cards used by Ceph storage nodes must implement NIC bonding to prevent network interruptions due to card failures.
Using Cache Tier
In a cloud storage environment, due to cost considerations, SSDs are usually used sparingly, while SATA hard drives are used in large quantities. In an OpenStack integrated Ceph cloud environment, how to utilize SSDs and SATA hard drives can be done in two ways.
The first method is to create independent SSD and SATA storage resource clusters. Then, the Cinder block storage service can interface with both sets of Ceph backend storage, allowing the cloud platform to create and use cloud disks with both SSD and SATA media.
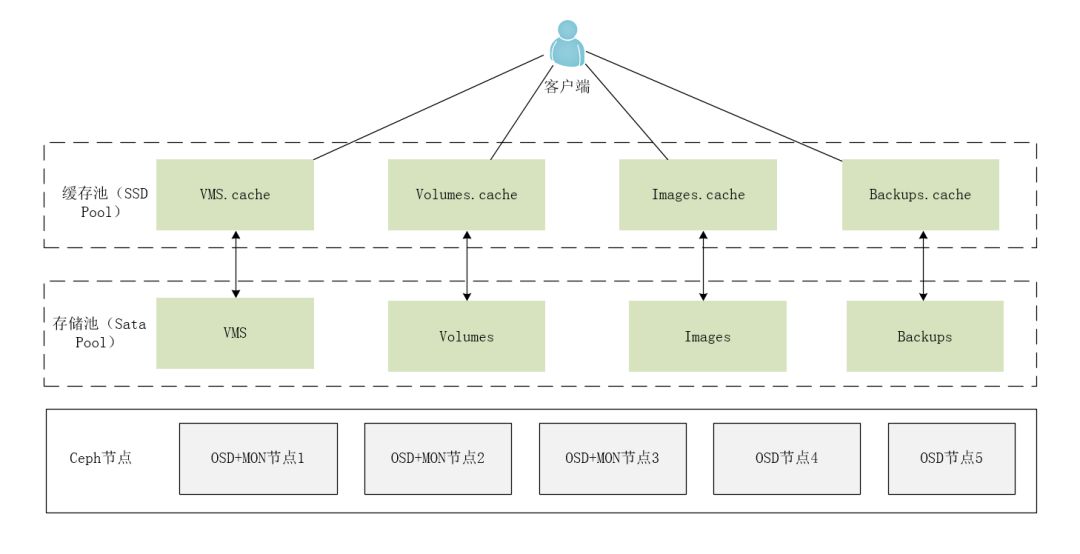
The second method is to use SSDs to create a relatively small but high-performance cache pool (Cache tier), while SATA hard drives create a large-capacity but lower-performance storage pool (Storage tier).
Here, I will explain using the second method as an example. When clients access operational data, they will first read and write data from the cache tier (of course, this depends on the cache mode). If the data is in the storage tier, it will be promoted to the cache tier. In the cache tier, there will be request hit algorithms, cache flush algorithms, and cache eviction algorithms to promote hot data to the cache tier and demote cold data to the storage tier.
The cache layer proxy automatically handles data migration between the cache layer and backend storage. During usage, we can configure migration rules based on our needs, with two main scenarios:
• Write-back mode: When the administrator configures the cache layer to writeback mode, Ceph clients will write data to the cache layer and receive an ACK from the cache layer; the data written to the cache layer will be migrated to the storage layer and then flushed from the cache layer. Intuitively, the cache layer is situated “in front of” the backend storage layer, and when Ceph clients need to read data from the storage layer, the cache layer proxy will migrate this data to the cache layer before sending it to the Ceph client. From then on, Ceph clients will perform I/O operations with the cache layer until the data is no longer read or written. This mode is ideal for volatile data (such as photo/video editing, transactional data, etc.).
• Read-only mode: When the administrator configures the cache layer to readonly mode, Ceph will write data directly to the backend. During reading, Ceph will copy the corresponding objects from the backend to the cache layer, with dirty objects being evicted from the cache layer based on predefined policies. This mode is suitable for immutable data (such as images/videos displayed on social networks, DNA data, X-Ray images, etc.) since data read from the cache layer may contain stale data, resulting in poorer consistency. Read-only mode should not be used for volatile data.
Independently Using Pools
Ceph can unify the backend storage for OpenStack Cinder block storage services (cinder-volume, cinder-backup), Nova compute services, and Glance image services. In production environments, it is advisable to create four separate storage resource pools (Pool) corresponding to the four OpenStack services. Additionally, the recommended number of replicas for each pool is three, as shown in the table below.
|
OpenStack Service |
Ceph Storage Pool |
|
Cinder-volumes |
volumes |
|
Cinder-backups |
backups |
|
Nova |
vms |
|
Glance |
images |
Finally, the deployment architecture of Ceph distributed storage is shown in the figure below.
User Application Layer
In many businesses, service high availability is often involved. Generally, high availability is implemented through VIP (Virtual IP). VIPs do not correspond to an actual network interface (NIC) like an IP address; they are virtual IP addresses, and utilizing their characteristics can achieve fault tolerance and migration.
In common node configurations, VIP configuration is straightforward and has few restrictions. However, in OpenStack instances, one IP corresponds to one Port device. Furthermore, Neutron has the “Allowed address pairs” restriction, which requires the MAC/IP of the Port to correspond to each other for connectivity. Operations on Port devices can achieve several functionalities:
• A single Port device can add multiple sets of Allowed Address Pairs, allowing multiple IPs to connect through that Port.
• One IP can correspond to multiple MAC addresses.
• One MAC address can correspond to multiple IPs.
Additionally, to establish a VIP in an OpenStack-created instance and ensure its functionality, the following methods can be used:
• Create the Port device for the VIP (to prevent the VIP from being reassigned).
• Update the Port device’s Allowed Address Pairs.
First step, create the Port device:
#source admin-openrc.sh // Import tenant environment variables
#openstack network list // View existing networks and select one to create the Port device
#openstack subnet list // View subnets under the selected network
#openstack port create –network NetWork_Name –fixed-ip subnet=SubNet_Name,
ip-address=IP Port_Name
#openstack port show Port_Name
At this point, the Port device has been created, but it is not yet associated with the instance that needs to establish the VIP, so creating a VIP on that instance will not work. The reason is as follows:
#neutron port-list |grep Instance-IP // Find the Port ID of the instance that needs the VIP configured
View the details of that Port:
#neutron port-show 17b580e8-1733-4e2e-b248-cde4863f4985
At this point, allowed_address_pairs is empty, so even if a VIP is created in the instance, its MAC/IP will not correspond, and it will not work. Therefore, the second step is to update the Port’s allowed_address_pairs information:
#neutron port-update Port-ID –allowed_address_pair list=true type=dict ip_address=IP
For example:
#neutron port-update 17b580e8-1733-4e2e-b248-cde4863f4985
–allowed_address_pairs list=true type=dict ip_address=172.24.1.202
Now, when checking the instance Port information:
#neutron port-show 17b580e8-1733-4e2e-b248-cde4863f4985
The VIP can now be created in the virtual machine and will work normally.
Operations and Maintenance Platform Construction
Monitoring is the most crucial aspect of operations and the entire product lifecycle, allowing for timely alerts to detect faults in advance and providing detailed data for post-event investigation and problem resolution. Currently, there are many excellent open-source products available in the industry. Choosing some open-source monitoring systems is a time-saving, labor-saving, and highly efficient solution.
Using Kolla for containerized deployment and management of the OpenStack cloud platform has become the mainstream trend. Here, I will discuss the construction of operation and maintenance platforms related to the cloud platform in the context of containerized deployment and management of OpenStack.
Monitoring Objectives
Let’s first understand what monitoring is, its importance, and its objectives. Of course, everyone’s understanding of monitoring varies based on their industry, company, business, and position. However, it is essential to consider monitoring from the perspective of the company’s business rather than focusing solely on the use of specific monitoring technologies.
The objectives of monitoring include:
1) Continuous real-time monitoring of the system: This is essentially continuous real-time monitoring of the system (this is monitoring); 2) Real-time feedback on the current state of the system: When monitoring a hardware component or system, we need to see whether the current system state is normal, abnormal, or faulty; 3) Ensuring service reliability and security: The purpose of monitoring is to ensure that the system, services, and business operate normally; 4) Ensuring the continuous and stable operation of business: If our monitoring is well-implemented, even in the event of a fault, we can receive alerts promptly and address them immediately, thus ensuring the stable operation of business continuity.
Monitoring System Layering
Monitoring relies on the collaboration of various operational and maintenance specialties, enhancing the monitoring system through layering and categorization. The monitored objects mainly include infrastructure hardware and application software, as illustrated in the figure below:
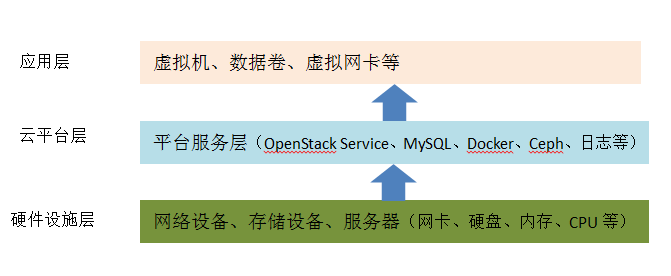
• Hardware Infrastructure Layer: Switches, routers, load balancers, firewalls, servers (hard drives, CPUs, memory, and network cards), etc.
• Cloud Platform Layer: Logs, databases, message queues, operating systems, OpenStack services, Ceph storage, Docker containers, system and application loads, etc.
• Application Layer: Virtual machines, data volumes, virtual network cards, etc.
Monitoring Methods
Generally, as systems operate, the operating system generates system logs, and applications generate access logs, error logs, running logs, and network logs. We can use EFK for log monitoring. For log monitoring, the most common requirements are collection, storage, querying, and display.
In addition to monitoring logs, we also need to monitor the operational status of systems and applications in real-time. Different monitoring objectives require different monitoring methods. For OpenStack cloud resource monitoring, such as monitoring VMs, images, data volumes, virtual network cards, etc., OpenStack’s built-in services like Ceilometer + Gnocchi + Aodh can naturally handle this (PS: Ceilometer can hand over collected data to Gnocchi for aggregation, and finally display reports using Grafana).
If the OpenStack cloud platform is based on Kolla for containerized deployment and management, then what should be used to monitor and alert Docker containers, operating system loads, storage space, etc.? Naturally, the TPIG stack comes into play.
What is the TPIG stack? It is a set of operational monitoring tools composed of Telegraf + InfluxDB + Grafana + Prometheus. The relationships between them are: Prometheus/Telegraf (data collection) —> InfluxDB (data storage) —> Grafana (data display).
Note: Prometheus and Telegraf do not need to be deployed simultaneously; you can choose to deploy both or just one based on your needs.
The following open-source tools or solutions are all supported by the Kolla community by default. The most important thing is how to use and improve them.
• The open-source solution for log collection and analysis is the EFK stack: fluentd/filebeat + elasticsearch + kibana.
• The open-source solution for performance collection and analysis is the TPIG stack: telegraf + influxdb + grafana + Prometheus.
Monitoring Methods
Understanding the monitoring object: Are you familiar with the object you want to monitor? For example, the IOPS of a hard drive? What performance indicators of the object are being monitored? For instance, the CPU usage rate, load, user mode, kernel mode, context switching. Alarm threshold definition: What constitutes a fault that requires an alarm? For example, what CPU load is considered high, and what are the high thresholds for user mode and kernel mode? Fault handling process: Once an alarm is received, how do we handle it? Is there a more efficient handling process?
Monitoring Process
• Data Collection: Collect data from systems and applications using Telegraf/Prometheus;
• Data Storage: Monitoring data is stored in MySQL, InfluxDB, or other databases;
• Data Analysis: When we need to analyze faults afterward, the EFK stack can provide us with graphics and time-related information to help pinpoint the fault;
• Data Display: Web interface display;
• Monitoring Alerts: Phone alerts, email alerts, WeChat alerts, SMS alerts, escalation mechanisms for alerts, etc. (any form of alert is possible);
• Alert Handling: When an alert is received, we need to handle it based on the fault level, such as: important and urgent, important but not urgent, etc. Based on the fault level, coordinate with relevant personnel for rapid resolution;
Monitoring Alerts
When the monitored object exceeds a certain threshold or when a service exhibits anomalies, automatic alerts are sent via email, SMS, or WeChat to relevant personnel.
Event Emergency Response
The most fundamental metric for operations is to ensure system availability, and the timeliness of emergency recovery is a key metric for system availability. Generally, there are several methods for emergency recovery, such as:
• If overall service performance declines or anomalies occur, consider restarting the service;
• If the application has undergone changes, consider whether to roll back the changes;
• If resources are insufficient, consider emergency expansion;
• If application performance issues arise, consider adjusting application parameters and log parameters;
• If the database is busy, consider analyzing through database snapshots to optimize SQL;
• If there are design errors in application functionality, consider urgently disabling function menus;
• There are many more…
Some Observations
In reality, there are often instances of “copycatism,” such as running Hadoop/Spark big data workloads on virtual machines, leading to various pitfalls once online. For example, poor disk I/O performance, VMs competing for host resources, resulting in CPU usage exceeding 700%, etc., ultimately leading to self-inflicted problems.
It is important to remember that the essence of cloud computing is virtualization, and the essence of virtualization is one-to-many, transforming physical computing resources, network resources, and storage resources into multiple logical resources (like KVM, Open vSwitch, Ceph), which are then abstractly provided to users by resource scheduling management systems (like OpenStack). Conversely, the essence of big data is many-to-one, unifying multiple computing, storage, and network resources for use by big data workloads.
OpenStack can manage both virtual machines and bare metal. The recommended approach is to run big data workloads on bare metal rather than on virtual machines. Violating the essence of technology will inevitably lead to a painful process.
Some users often grapple with which solution to adopt when moving to the cloud or using cloud services. For example, should they use Open vSwitch or Linux Bridge? VLAN or VXLAN, GRE? Ceph or GlusterFS, commercial storage? Should they undertake secondary development? It is crucial to understand that technology does not dictate requirements; rather, requirements dictate technology selection. Similarly, the choice of which technology to use should be determined by actual needs. The best solution is the one that suits your needs. Both options have their pros and cons, and users need to navigate the risks and select the most advantageous solution.
When preparing to use OpenStack, it is essential to clarify that OpenStack is a knowledge-intensive open-source cloud framework. Remember that it is a framework, not a plug-and-play product. The required technical talent and reserves are extensive, and companies often face talent shortages. On the one hand, it is challenging to recruit experienced personnel from outside; on the other hand, cultivating internal talent is time-consuming and labor-intensive. If a company only uses OpenStack for private cloud purposes with non-complex functional requirements (e.g., to replace expensive VMware for virtual machine services), secondary development is generally unnecessary. Conversely, if OpenStack is to be provided as a cloud product to third-party users or to meet complex internal business needs, secondary development becomes necessary, such as unified cloud resource management, logical resource scheduling, operational monitoring and alerts, and support for IaaS + PaaS + SaaS. In practice, some business leaders misinterpret OpenStack as akin to Alibaba Cloud or AWS, either overestimating their capabilities or underestimating the difficulties of OpenStack, believing it is merely a matter of modifying a dashboard, ultimately falling into a cycle of failure.
In conclusion
As technology evolves, the trend of platform complexity increasing while user simplicity decreases will become increasingly evident. This requires that the systems ultimately presented to users must be extremely simple. I believe that OpenStack is striving in this direction, turning the essential needs of enterprise users into actionable realities, and its future will be brighter!
Finally, I would like to thank OpenStack and my former company leaders and colleagues who guided me into this field, opening the door to cloud computing for me! I also hope that one day, OpenStack can transition from a product enjoyed only by large enterprises to one accessible to ordinary entrepreneurs.
OpenStack is still young and has every reason to continue forward!
Xuchao, a practitioner and learner of OpenStack, Kubernetes, Docker, and CI/CD, author of “OpenStack Best Practices – Testing and CI/CD”, and participant in the OpenStack open-source community. Personal blog: https://xuchao918.github.io
↓↓ Click “Read the original text” to join the cloud technology community.
Related Reading:
5 Years! Some of My Views on OpenStack
8 Years! The Pits I’ve Encountered on My OpenStack Journey…
6 Years! The Rivers I’ve Crossed with OpenStack, Which I Rely on for a Living…
eBay Abandons OpenStack! Embracing Kubernetes and Docker
Enterprise-level PaaS Cloud Platform: Key Issues and Challenges Not to Be Ignored
A Survey of Government Adoption of Cloud Services
More articles, please follow