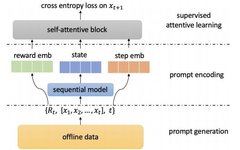
We instantiated PRL using four deep learning-based sequential recommendation models and conducted experiments on two e-commerce datasets, Challenge15 and RetailRocket4. The experiments aimed to answer the following three research questions to verify the effectiveness of the PRL learning paradigm:
● How does PRL perform when instantiated on different sequential recommendation models?
● What is the effect of supervised attention learning, including self-attention modules and weighted loss functions?
● How does the prompt reward setting affect the performance of PRL during the inference phase?
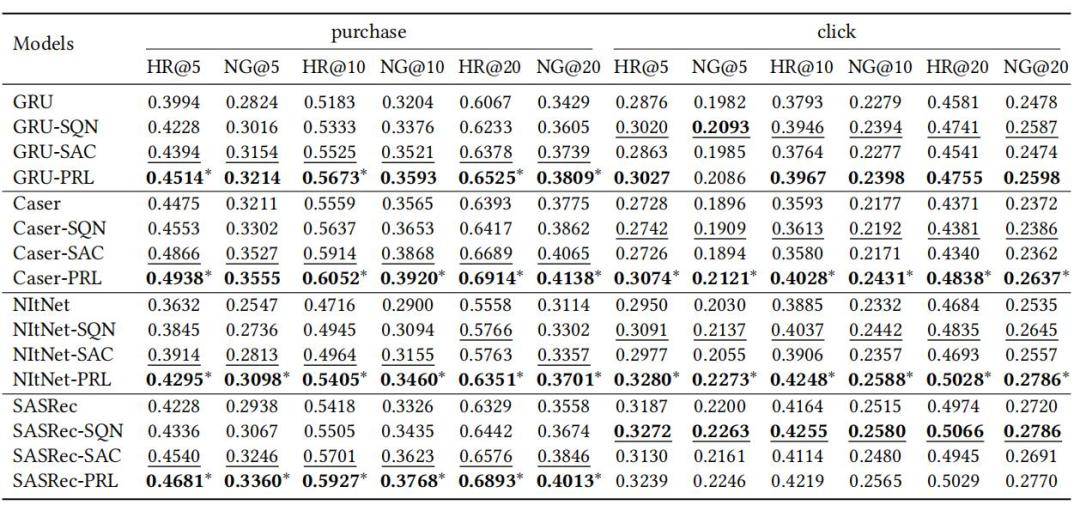
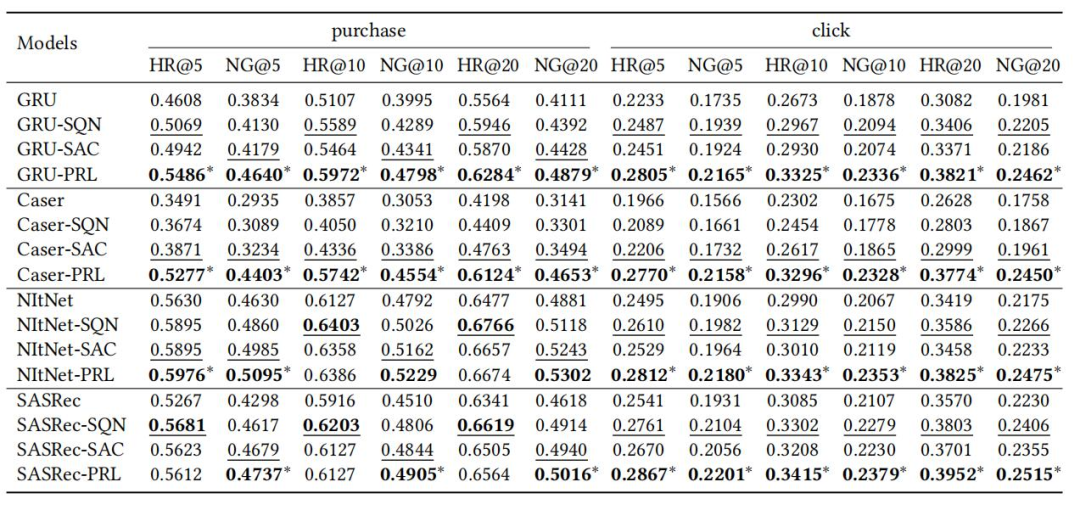
For question one, we compared the results with baseline models, as shown in Tables 1 and 2. In both the Challenge15 and RetailRocket4 datasets, PRL achieved the best performance in almost all cases, demonstrating that PRL consistently and significantly improves the offline learning performance of RL-based recommendation tasks and can be applied to various sequential recommendation models.
(Table 1: Comparison of PRL and Other Models in Top-N Recommendation Performance on Challenge15 Dataset)
(Table 2: Comparison of PRL and Other Models in Top-N Recommendation Performance on RetailRocket4 Dataset)
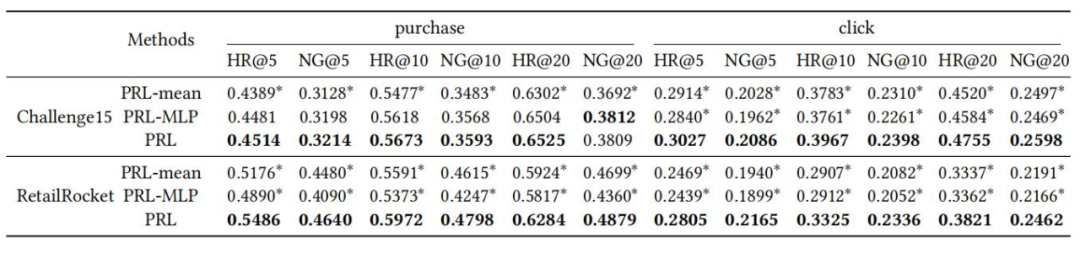
For question two, we conducted ablation experiments on different aspects. For the study of the effect of the self-attention module, we replaced the self-attention block with average pooling (PRL-mean) or multi-layer perceptron (MLP) (PRL-MLP), and the results are shown in Table 3, indicating that PRL with the self-attention module achieved significant performance improvements.
(Table 3: Effect of Self-Attention Module)
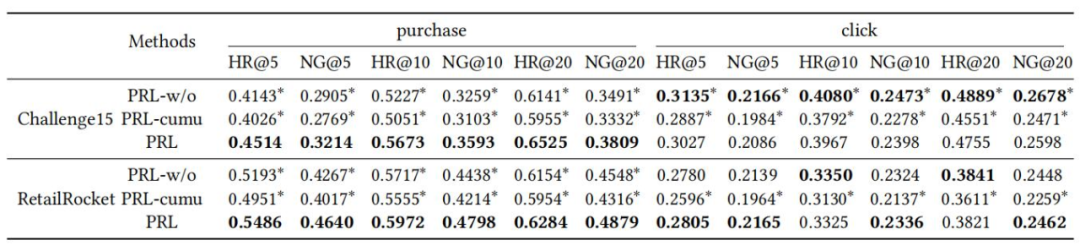
For the study of the effect of re-weighting, we compared the results of PRL without any re-weighting (PRL-w/o) with those of PRL re-weighted by cumulative rewards (PRL-cumu), as shown in Table 4, demonstrating that PRL’s re-weighting successfully helps the model recommend more products with higher prompt rewards.
(Table 4: Impact of Weighted Loss)
For question three, we conducted experiments to study the impact of the expected inference reward μ and the inference reward deviation ϵ on the model’s performance. The results are shown in Figures 4 and 5 respectively:
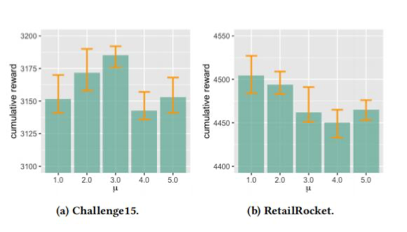
(Figure 4: Effect of Expected Inference Reward μ)
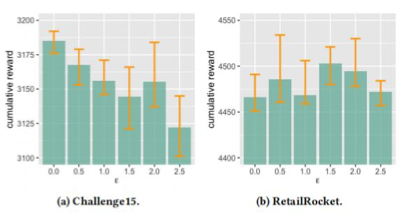
(Figure 5: Effect of Inference Reward Deviation ϵ)