

————————————
Exclusive compilation, unauthorized use will be pursued
Introduction
In today’s wave of new drug development, AI (Artificial Intelligence) technology is continuously breaking through, from early virtual screening to today’s molecular generation models, significantly improving the efficiency of drug discovery. We all know that one of the key reasons for drug failure is pharmacodynamics (PD) and safety. The efficacy and safety are closely related to the processes of absorption, distribution, metabolism, and excretion (ADME) of the drug in the body, which is known as pharmacokinetics (PK). Only by considering both PD and PK can new drugs have a higher success rate in later clinical trials.
In this context, the work introduced in this article, “Integrating Pharmacokinetics and Quantitative Systems Pharmacology Approaches in Generative Drug Design”, presents an innovative approach by incorporating PK parameters into the AI generative drug design framework. Additionally, they combine these newly generated compounds with Quantitative Systems Pharmacology (QSP) models to simulate and predict the potential tumor suppression effects of drugs in the body, achieving a complete chain from drug generation to efficacy prediction. This is of great reference value for researchers and pharmaceutical researchers who want to grasp the deep integration of cutting-edge AI technology and drug development.
This article will provide a detailed introduction from the following aspects:
-
Background and Research Motivation: Why incorporate PK into AI generative drug design? What are the shortcomings of existing methods? -
Methodological Framework: Including data collection, QSPR model training, reinforcement learning strategies for DrugEx generation models, and the design and simulation of QSP models. -
Results Analysis: Including QSPR prediction accuracy evaluation, multi-objective optimization performance of generated molecules, and QSP model results for simulating the efficacy of generated molecules. -
Discussion and Insights: Limitations of the system, improvement directions, and application prospects.
Background: Why Integrate PK and PD into AI Drug Generation?
Failures of drugs at different stages of development are often attributed to efficacy and safety issues. PD and PK are closely related; on one hand, compounds need to have excellent in vitro activity (usually referring to binding affinity for the target), and on the other hand, their pharmacokinetic behavior in the body (such as clearance rate CL, volume of distribution VDSS, plasma free fraction FU, etc.) must also meet certain requirements. However, most existing AI molecular generation or screening methods still mainly focus on the binding affinity of molecules to targets or simple ADMET filtering, lacking a systematic consideration of pharmacokinetics.
To truly improve the success rate of drug development, it is necessary to incorporate important parameters of pharmacokinetics (PK) into the initial molecular design and to understand the pharmacodynamic (PD) effects of these molecules as early as possible in human or animal models. The Quantitative Systems Pharmacology (QSP) model is a quantitative tool that depicts multiple biological pathways and drug action mechanisms in the body, linking the changes in drug concentration to physiological and biochemical processes, thereby simulating the final efficacy of different doses and molecular characteristics. In this work, researchers first use the QSPR (Quantitative Structure-Activity Relationship) model to predict the PK parameters of molecules and target affinity, and then incorporate these parameters into a QSP model specifically studying the immuno-oncological effects of the adenosine A({2A}) receptor (A({2A})R), to simulate the anti-tumor effects of new molecules, forming a complete strategy.
Specifically, they focused on three PK parameters:
-
Clearance Rate CL -
Steady-State Volume of Distribution VDSS -
Plasma Free Fraction FU
and the binding affinity of A({2A})R (pKi). A({2A})R is an important target in immuno-oncology, and its inhibition can enhance immune responses in the tumor microenvironment.
Research Methodology Explained: From QSPR to QSP to AI Generation
Next, let us delve into the methodology section of this study. The overall process is illustrated in Figure 1.
(Figure 1)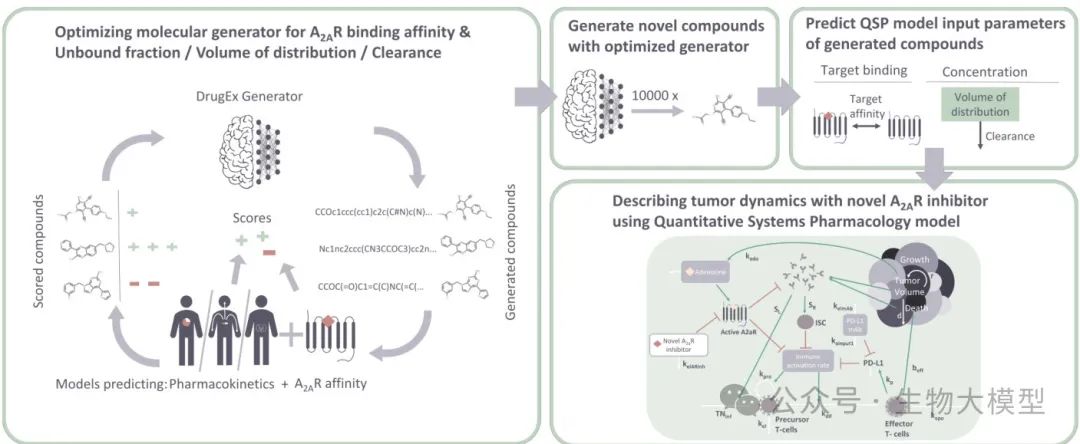 Figure 1 Content: This figure shows the integrated process proposed by the authors, including: 1) Using QSPR models to predict the A(_{2A})R affinity and PK parameters of candidate molecules; 2) Using these predicted results as the reward function for reinforcement learning, guiding the DrugEx generator to generate new molecules; 3) Based on multiple selected new molecules, inputting their predicted parameters into the QSP model to simulate their tumor growth inhibition curves, thereby assisting in assessing the final efficacy.
Data Collection
-
A(_{2A})R Dataset
-
Source: Obtained from the Papyrus database (version 05.6), extracting pKi data for human A(_{2A})R and performing strict screening (removing low-quality data, and those containing specific groups such as selenium). -
Finally, 3318 high-confidence activity data were obtained.
PK Dataset
-
Source: The publicly available human PK database from Lombardo et al., containing three major parameters for 1352 drugs (CL, VDSS, FU). -
Removed macromolecules (molecular weight >900), molecules containing metal elements, etc.; logarithmic transformation was applied to CL and VDSS, and square root transformation to FU to reduce data skewness. -
Finally, obtained: 1239 records (CL), 1207 records (VDSS), 860 records (FU).
These data will undergo applicability domain determination in subsequent steps to ensure that molecular generation during reinforcement learning does not exceed the model’s credible range.
QSPR Model Training
To accurately predict the A(_{2A})R affinity, CL, VDSS, and FU of new molecules, the researchers developed a QSPR model and conducted comprehensive grid searches using the QSPRpred tool (version 3.0.2), including:
-
Feature selection (e.g., using RDKit molecular descriptors, Morgan fingerprints, Boruta filtering, etc.), -
Model types (Random Forest, Support Vector Machine, K-Nearest Neighbors, etc.), -
Hyperparameter selection.
(Table 1) The table below (originally Table 1) shows the main content of the grid search parameter space:
|
|
|
|
|
|
|
|
|
|
||
|
|
|
|
|
|
|
|
|
|
|
|
|
|
||
|
|
|
|
|
|
|
|
|
|
|
|
|
|
|
|
Table 1 Content: This table details various parameter options during data preprocessing and model grid search, including different descriptor sets (RDKit, MorganFP, etc.), different feature filters (high correlation filtering, Boruta, etc.), and hyperparameters for different machine learning models (Random Forest, SVM, Partial Least Squares, etc.).
Finally, the model performance was evaluated through cross-validation (5-fold) and a 20% independent test set to obtain the best combination. Bootstrapping and applicability domain testing were also conducted to further validate the robustness of the model.
QSPR Model Formula Brief: For a certain drug property (Y), the QSPR model is essentially [ Y \approx f(\mathbf{x}) ] where (\mathbf{x}) represents molecular descriptors or fingerprints, and (f) is the trained function (such as Random Forest, SVM, etc.). Different (f) are trained based on different targets (CL, VDSS, FU, pKi).
Applicability Domain
The researchers used the TOPKAT Optimum Predictor Space (OPS) method to define the applicability domain of each model, and verified its ability to distinguish between inliers and outliers in random and cluster splitting tests. The results showed that the prediction accuracy for test molecules within the domain (inliers) is significantly higher than for those outside the domain (outliers), which has a much larger error. This domain information will be used in subsequent reinforcement learning stages for rewards or filtering.
Training of the Generative Model DrugEx
1. Overall Idea
The researchers selected DrugEx, an AI molecular generation model based on recurrent neural networks (RNN) (version 3.4.7). First, they pre-trained the model using large-scale data from Papyrus to obtain an initial model capable of generating broad-spectrum compounds; then, they performed fine-tuning and reinforcement learning:
-
Fine-tuning: Further train the pre-trained model on molecules filtered from the A(_{2A})R and corresponding PK datasets, allowing the generator to converge towards the distribution of active compounds with actual measured values. -
Reinforcement Learning: After obtaining a preliminary fine-tuned model, set multiple objectives (such as maximizing A(_{2A})R affinity, minimizing or maximizing CL/VDSS/FU, etc.), and convert QSPR model prediction values into rewards, guiding DrugEx to search for molecules that meet the objectives in chemical space.
2. Multi-Objective Reward Function in Reinforcement Learning
They adopted the built-in multi-objective method based on Pareto ranking in DrugEx. A scoring strategy was set:
-
For attributes to be maximized, the higher the predicted value of the molecule for that attribute, the higher the score; if below a certain percentile, it counts as 0; above a certain percentile, it counts as full score 1; linear mapping in between. -
For attributes to be minimized, the opposite operation applies; the lower the value, the higher the score. -
There is also a scoring for applicability domain (whether it is within the domain); if it exceeds, the score is set to 0, or the total score is reduced in conjunction with other objectives.
They set 13 scenarios, such as:
-
Single Objective: Maximizing A(_{2A})R, or maximizing CL, or minimizing FU, etc.; -
Dual Objectives: Simultaneously maximizing A({2A})R and minimizing CL, or maximizing A({2A})R and minimizing VDSS, etc.
Reinforcement learning was conducted for 2000 epochs, with each epoch based on the trained “agent” model + fixed “mutation network” + a certain mutation rate epsilon (the authors chose 0.1) to generate molecules, calculate molecule rewards, and update model parameters. The process stops early if there is no improvement for a long time.
Results and Discussion (I): QSPR Prediction Accuracy
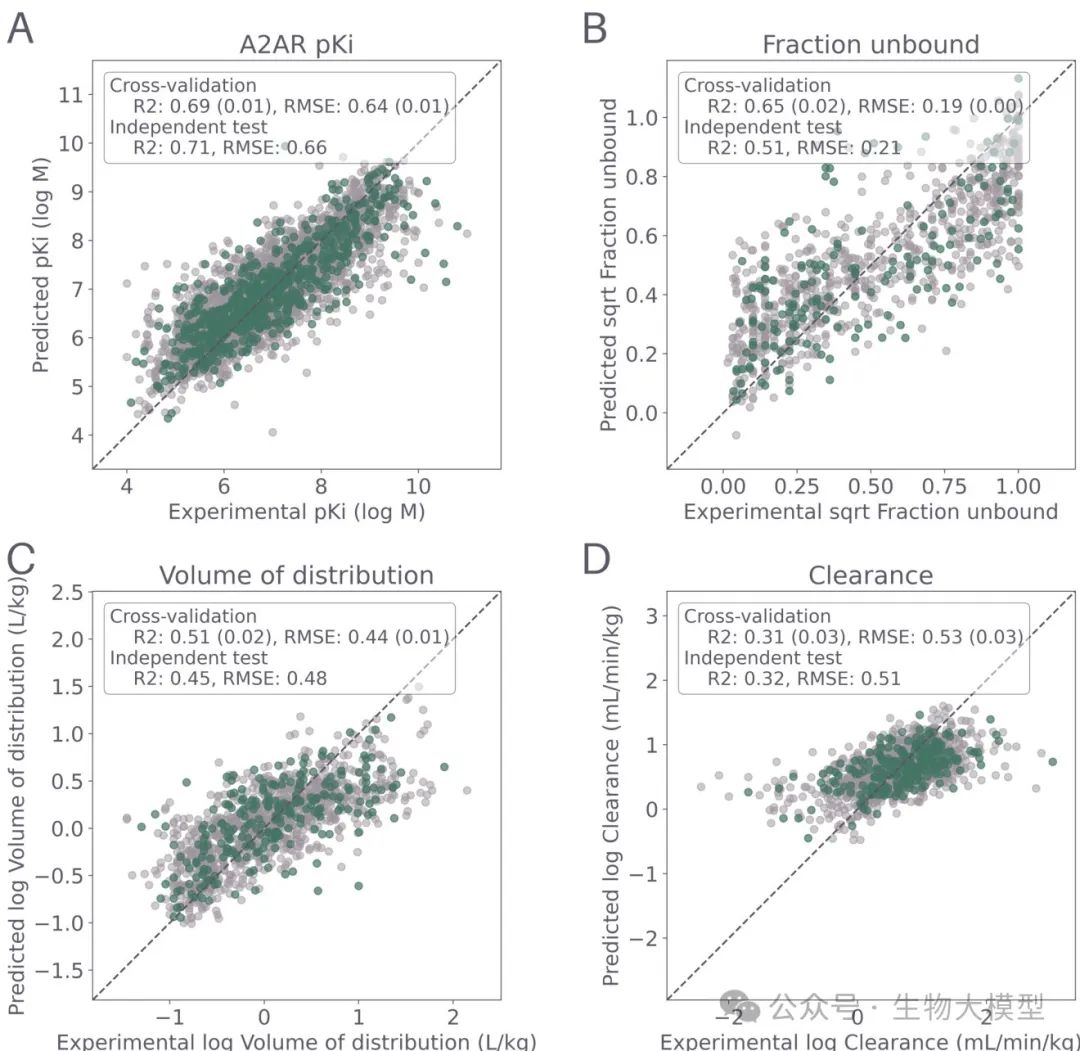
The researchers first validated the performance of four QSPR models (pKi of A(_{2A})R, CL, VDSS, FU) under independent test sets and cross-validation, as shown in Figure 2.
(Figure 2) Figure 2 Content: The X-axis represents the experimentally measured true values, and the Y-axis represents the model predicted values. Light gray points represent 5-fold cross-validation, and green points represent the 20% independent test set. Each subplot corresponds to (A) A(_{2A})R pKi, (B) CL, (C) FU, (D) VDSS. The (R^2) and RMSE are also marked in the figure. It can be seen that:
-
pKi model: (R^2 \approx 0.69), RMSE about 0.64. -
CL model: (R^2 \approx 0.34), RMSE about 0.71, prediction is more difficult. -
FU model: (R^2 \approx 0.64), RMSE about 0.22 (after square root transformation). -
VDSS model: (R^2 \approx 0.51), RMSE about 0.44.
From this, it can be seen that CL prediction is indeed challenging, consistent with previous literature reports; while the A(_{2A})R pKi model performed relatively well.
To analyze the robustness of the model more intuitively, the authors conducted Bootstrapping and applicability domain evaluations, as shown in Figure 3.
(Figure 3)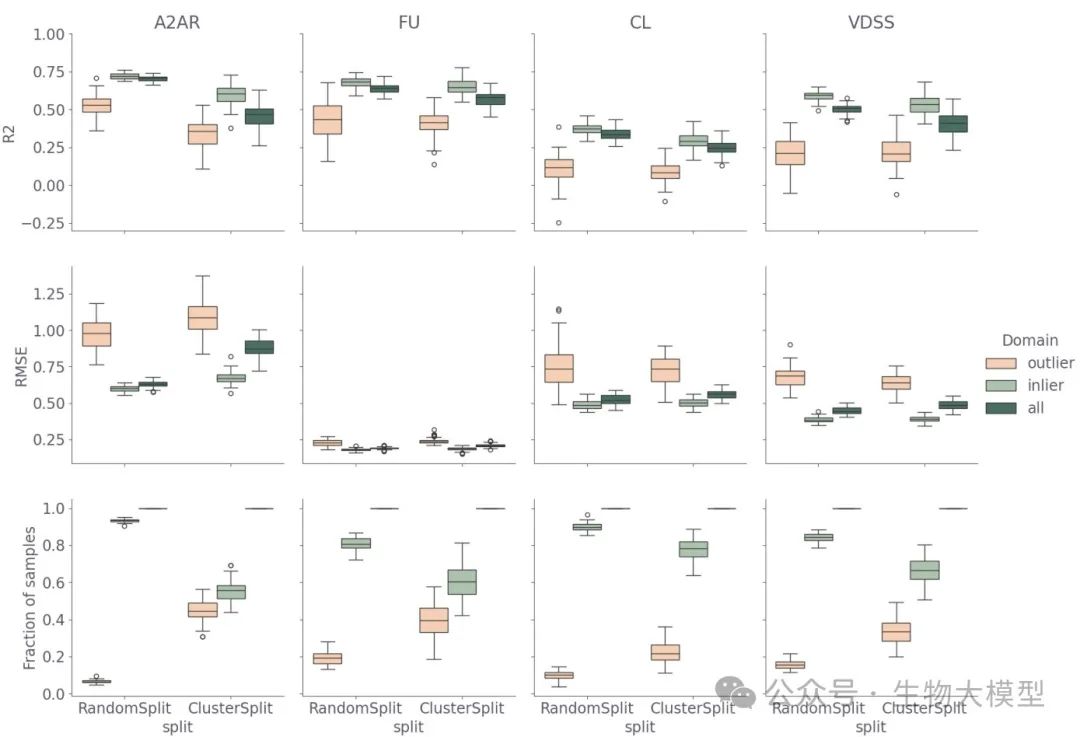 Figure 3 Content: This shows the (R^2), RMSE, and the ratio of inliers/outliers in the test set for multiple random splits and cluster splits. Light green represents inliers (within the domain), orange represents outliers (outside the domain), and dark green represents the entire test set. It can be seen that:
-
The prediction effect for in-domain is always much better than for out-of-domain. -
The A({2A})R data shows a greater decline in (R^2) during cluster splitting, which is because the diversity of A({2A})R data itself is smaller, and cluster splitting makes the chemical structure differences between the training set and test set larger. -
PK data also shows a similar but less severe situation.
In summary, the applicability domain method can effectively distinguish between prediction levels within and outside the domain.
Results and Discussion (II): Multi-Objective AI Generation Performance
The researchers generated 10,000 molecules using DrugEx under different objectives and compared their effectiveness, uniqueness, novelty, and multi-objective attribute distributions. The table below lists the statistics of the fine-tuned model and the reinforcement learning model in terms of effectiveness rate, uniqueness rate, proportion in or out of the library, and synthetic feasibility, detailed in the original Table 2 (the content is too long to present all rows in HTML, but the core points are as follows):
-
After fine-tuning, the model’s effectiveness and uniqueness rates slightly decreased but remained at a high level. -
During the reinforcement learning phase, the generated molecules showed significant distribution changes based on different objectives; -
When it is required to be within the QSPR applicability domain, many molecules outside the domain will be filtered out, thus limiting the exploration of the entire chemical space and making the final molecules more concentrated and similar.
Key Question: Did we achieve the goal of “simultaneously maximizing/minimizing”?
1. Optimization for A(_{2A})R pKi
Figure 4A shows the predicted distributions when optimizing only A({2A})R, and multi-objective (maximizing FU or minimizing FU) for A({2A})R. From the left pKi distribution, it can be seen that maximizing only A(_{2A})R yields an average pKi of 8.76 (significantly better than the fine-tuned model of 6.62). However, if FU maximization/minimization is added, the pKi may be slightly compromised.
(Figure 4)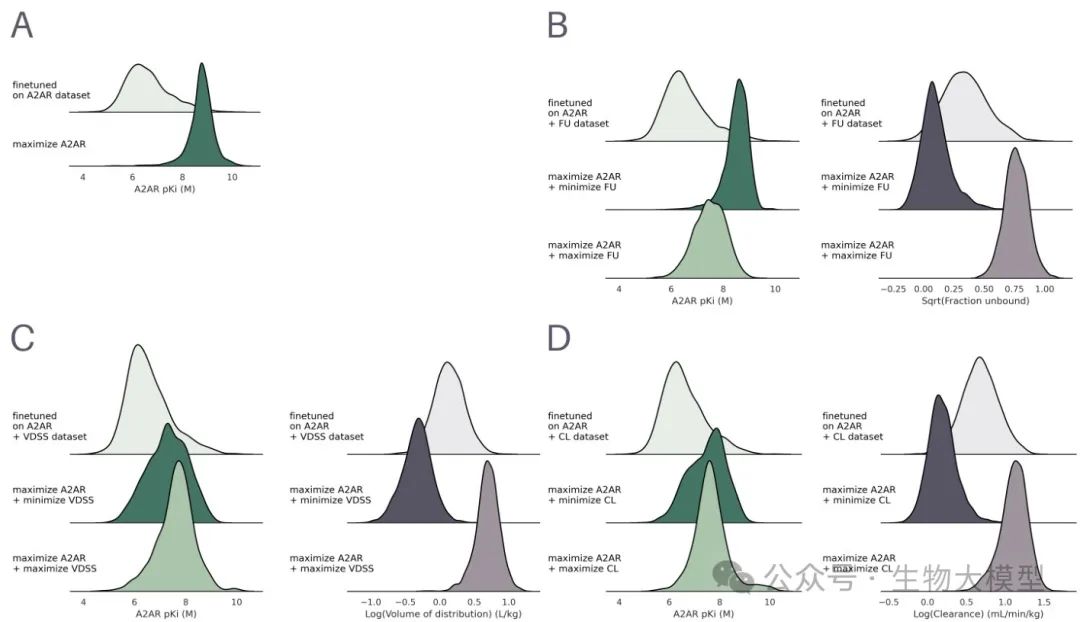 Figure 4 Content: The different columns correspond to three PK parameters (FU, VDSS, CL) and the pKi distributions of new molecules when optimizing A({2A})R simultaneously with PK values (left) and the corresponding distributions (right). (B) is the A({2A})R+VDSS scenario, (C) is the A(_{2A})R+CL scenario.
It can be clearly seen that different objectives will guide the molecular distribution to change significantly. For example, when optimizing A({2A})R+minimizing CL, the CL values concentrate at a lower end; when maximizing A({2A})R+maximizing CL, they concentrate at a higher end.
2. Visualization of Chemical Space
The researchers constructed a UMAP projection map (see Figure 5) to visualize the training dataset and molecules generated by different models.
(Figure 5) Figure 5 Content: The top row shows the distribution of molecules in the dataset based on A(_{2A})R pKi or PK attributes (the darker the color, the larger/smaller the attribute). The second row is the heat map of molecules generated only by the fine-tuned model. The third and fourth rows are the molecular distributions during reinforcement learning, maximizing or minimizing PK attributes, respectively. The boxed numbers indicate the positions of subsequent example molecules.
It can be clearly seen that:
-
The distribution of fine-tuned molecules generally matches the dataset. -
If only optimizing A(_{2A})R affinity, the molecules will cluster in the high pKi region of the dataset. -
If further optimizing CL, etc., it will further concentrate in the regions corresponding to high or low CL values.
3. Differences in Molecular Structure
Figure 6 lists several generated molecules and their most similar compounds in the dataset. It can be seen that when we require simultaneous maximization of VDSS or minimization of CL, the generated molecules tend to favor different cores or scaffolds, and corresponding physicochemical properties also exhibit regular patterns.
(Figure 6)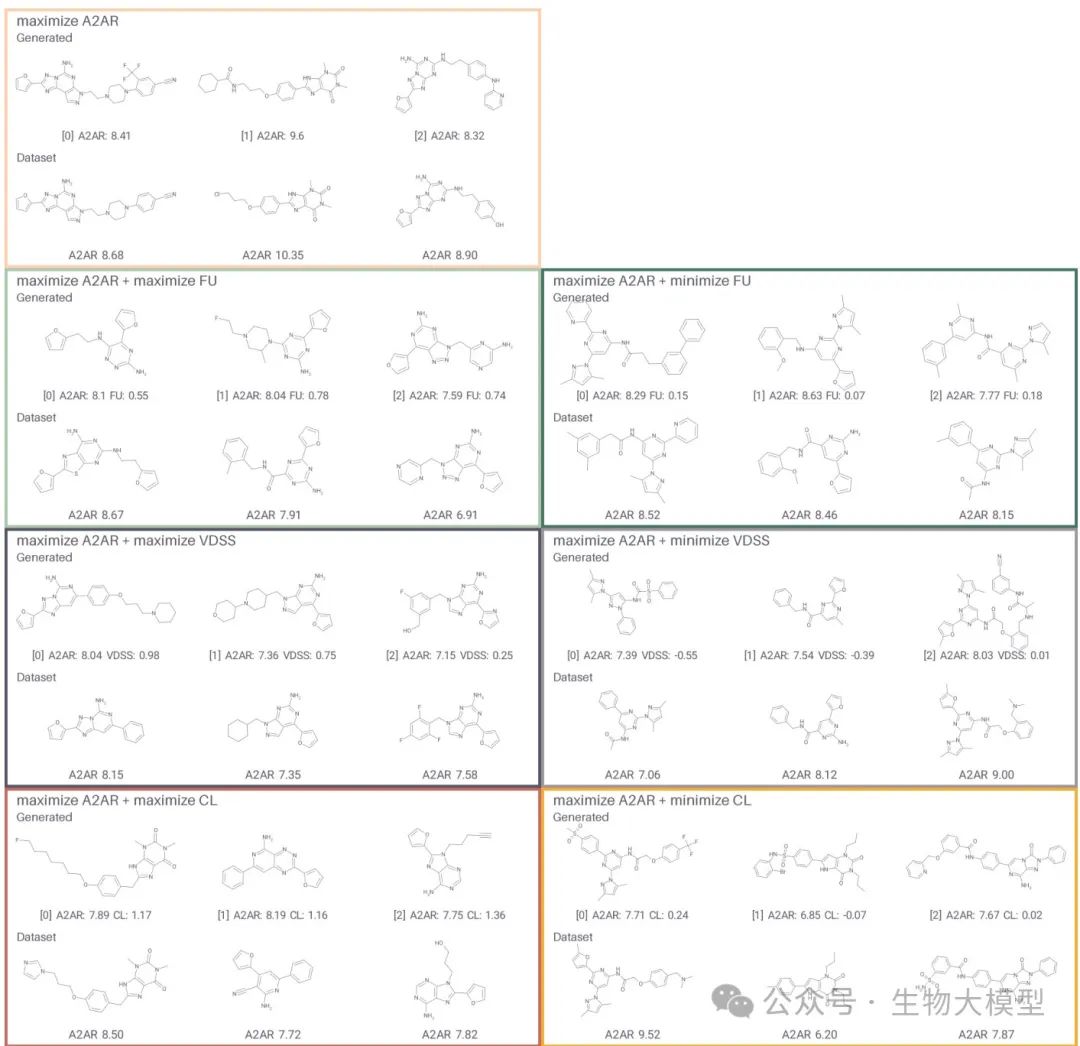 Figure 6 Content: In each gray box, the upper row is the generated molecule (predicted values indicated), and the lower row is the most similar known dataset molecule (experimental pKi or other information indicated). This visually shows the “approximate parent” of the generated molecules.
Figure 7 further compares the generated molecules from the perspective of physicochemical properties, including molecular weight, topological polar surface area, LogP, sp(^3) carbon ratio, etc.
(Figure 7)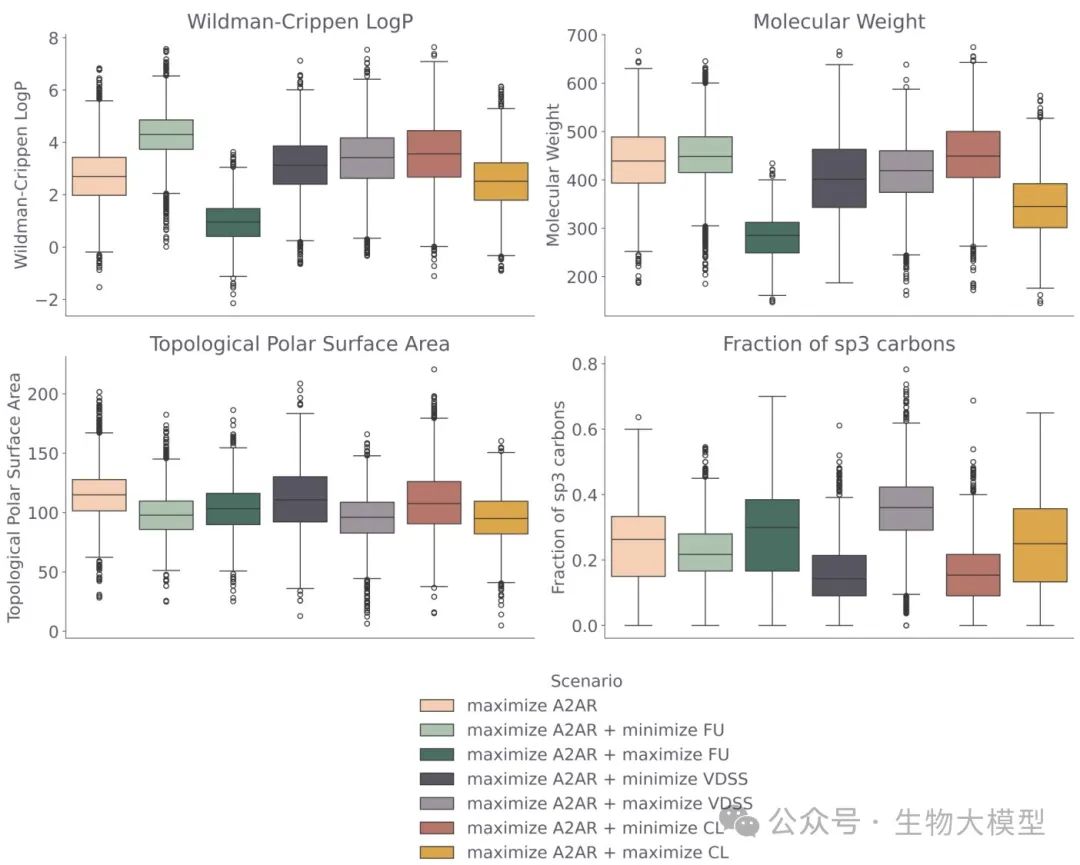 Figure 7 Content: It can be seen that when maximizing FU, the model tends to favor lower LogP, lower molecular weight, and higher sp(^3) carbon ratio; this aligns with the trend of high FU molecules in real data.
In summary, multi-objective reinforcement learning can effectively guide molecular structures and physicochemical properties to change in the desired direction, capturing the differences in properties corresponding to the PK database.
Results and Discussion (III): QSP Model for Efficacy Simulation
The research ultimately also needs to be reflected in the PD level of efficacy. The authors constructed a QSP model in this article, specifically to simulate the immunological regulation and tumor growth suppression of A(_{2A})R inhibitors in mouse tumor models. This model is based on previous research by Voronova et al. (reference [18]), constructing key processes in the immune system such as T cell, tumor cell, adenosine concentration, and A(_{2A})R occupancy, and simulating after combined administration with anti-PD-L1 monoclonal antibodies.
Core Equations of the QSP Model:
-
The administration method is changed to a one-compartment intravenous administration model: where (Ac2) is the amount of A({2A})R inhibitor in the central compartment (small compartment), (Cc2) is the concentration, (MW) is the molecular weight, (Vc) is the volume of the central compartment, and (k{el_{ARinh}}) is the elimination rate constant.
-
Since this is for mouse models, the authors used allometric scaling for cross-species inference: where (
alpha) takes 0.65 for CL and 0.95 for VDSS, and (BW) are 70 kg for humans and 0.025 kg for mice. This allows predictions made in humans to be estimated for mice. -
In the immune module, the higher the concentration of A(_{2A})R inhibitors, the stronger the antagonistic effect against adenosine-mediated immune suppression, thereby enhancing T cell killing of tumors. The system also includes the synergistic effect of PD-L1 monoclonal antibodies.
Model Structure Illustration as shown in Figure 8A:
(Figure 8)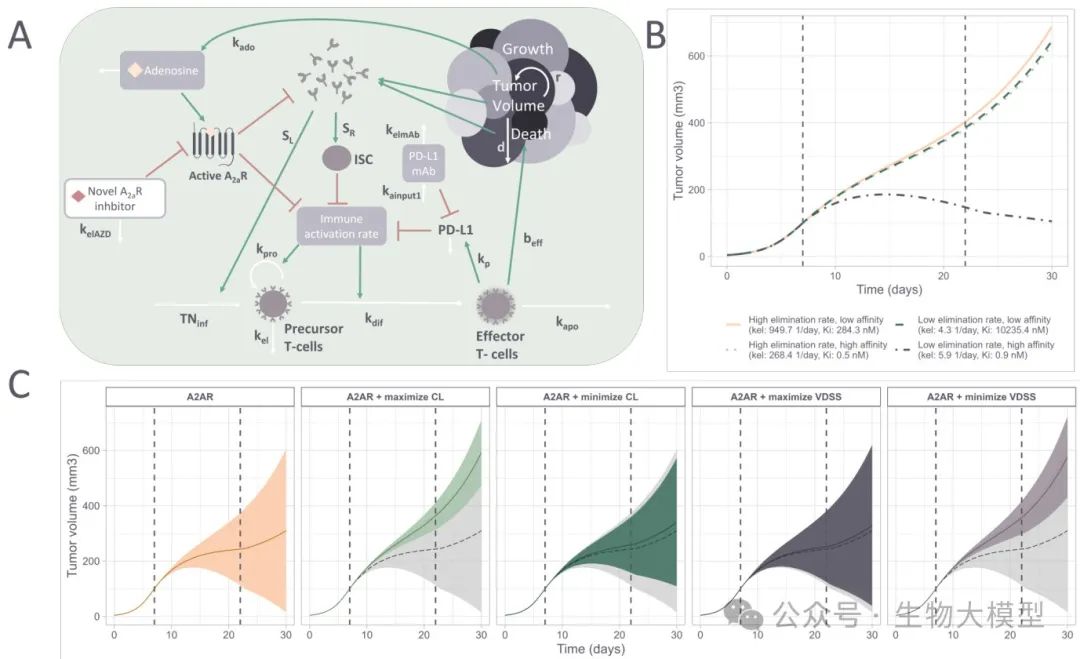
-
Figure 8A Content: Simplified arrows illustrate the mechanisms of tumor cell growth, immune suppressor cells, T cell precursor proliferation, etc., and the overall concentration of A(_{2A})R inhibitors blocking immune suppression. Red arrows indicate inhibition, green arrows indicate promotion, and white arrows indicate neutral dynamic changes.
QSP Simulation Results
As shown in Figure 8C, the authors simulated the efficacy over 30 days for molecules generated from different models (using their A(_{2A})R affinity, CL, VDSS predicted values, converted to mouse parameters) with administration from day 7 to day 22. The gray shadow indicates the baseline without treatment. The results found that:
-
If only pursuing high A(_{2A})R affinity, some molecules can produce stronger tumor suppression effects. -
If optimizing CL and VDSS on top of that, it can enhance efficacy by increasing exposure time/concentration, but if affinity is sacrificed too much, the overall effect may not be better. -
This indicates that sometimes trying to compensate for low affinity by improving distribution or lowering clearance rate does not always succeed, PK and PD indeed need to be optimized simultaneously.
Figure 8B shows the tumor growth curves for four extreme molecules (e.g., high affinity + high CL, low affinity + low CL, etc.), further proving that both are crucial.
Summary of Figure 8 Content:
-
Good PK but poor affinity may still not achieve ideal efficacy; -
Poor PK but high affinity may also lose the ability to maintain effective exposure over a long time. -
Comprehensive consideration is needed during reinforcement learning.
Discussion and Future Outlook
From the results, it can be seen that although the prediction accuracy of the CL model is weak (with (R^2) only around 0.34), it still demonstrates the ability to regulate molecular structure distribution in multi-objective reinforcement learning. This indicates that even if the QSPR model performance is not perfect, as long as the applicability domain and multi-objectives are combined, it can help generate molecules evolve in the desired direction.
However, this method still has room for improvement:
-
Difficulty in CL Prediction: The authors also pointed out that further combination with multi-species data, PBPK models (physiologically-based pharmacokinetic models), or splitting CL into sub-modules such as metabolic clearance and renal clearance could improve accuracy. -
Limitations of Applicability Domain: Currently, using TOPKAT OPS for rigid determination significantly limits the exploration space, filtering out some potentially innovative molecules. In the future, it may be possible to use progressive scoring rewards (e.g., negatively weighting the Mahalanobis distance from the center) and active learning strategies to gradually expand training data. -
Synthetic Feasibility Not Considered: Although the article mentions that some scoring (such as SA Score) can be used, in experimental applications, it is usually necessary to more rigorously include synthetic pathway assessments, such as RETROSYN and LED3 tools, to ensure that new molecules are truly “synthesizable”. -
Flexibility in Dose Design: The dosing scheme in this article is fixed; using optimization algorithms to allow the model to find the synergistic optimum (minimum toxicity, maximum efficacy) between dose and drug characteristics may better guide structural optimization.
Most importantly, the core contribution of this work lies in proposing and demonstrating a feasible process that integrates PK, PD (QSP), and AI large model generation, paving the way for future incorporation of more physiological, toxicological, multi-target, and other factors into early drug design.
Conclusion
Summary of Research Conclusions:
-
By directly incorporating PK parameters such as CL, VDSS, and FU as reinforcement learning objectives in the DrugEx generation model, it is possible to guide molecules towards better (or worse) PK characteristics while retaining high affinity for the A(_{2A})R target. -
Different PK optimization scenarios (maximizing or minimizing certain parameters) will lead to entirely different chemical scaffolds and physicochemical property distributions, which match the differences of high/low value compounds in the real PK database. -
Using the QSP model for simulation proves that both high affinity and good PK exposure are necessary for achieving better tumor suppression effects, and single optimization does not necessarily compensate for the other disadvantage. -
This method provides a template for the “generative AI + QSPR + QSP” closed loop in drug development, but attention must also be paid to model uncertainties and applicability domains.
Appendix and Resource Links
(1) Source Code and Data
-
All analysis data has been uploaded to Zenodo: https://zenodo.org/records/14449222 -
Code is open-sourced on GitHub: https://github.com/CDDLeiden/PK-in-generative-drug-design
(2) Key References The following only lists key sources mentioned in the text:
-
Dowden, H.; Munro, J. Trends in clinical success rates and therapeutic focus. Nat Rev Drug Discov 2019. -
Chen, E. P. et al. Model-based Target Pharmacology Assessment: PBPK/PD + Machine Learning. J Med Chem 2021. -
Lombardo, F. et al. Trend Analysis of a Database of Intravenous Pharmacokinetic Parameters in Humans for 1352 Drug Compounds. Drug Metab Dispos 2018. -
Voronova, V. et al. Evaluation of Combination Strategies for the A2AR Inhibitor AZD4635 Across Tumor Microenvironment Conditions via a Systems Pharmacology Model. Front Immunol 2021.
(3) QSP Model Equations and Parameters
-
Complete equations can be found in the Supplementary information. As introduced above, they mainly consist of pharmacokinetic one-compartment models and immune dynamics. -
This model covers multiple immune pathways and tumor cell growth parameters, and can change some initial conditions based on individual differences.
(4) Summary of Technical Points
-
Reinforcement Learning + Multi-Objective Scoring (Pareto + Tanimoto Distance): Efficiently searches in high-dimensional molecular space. -
Bootstrapping and Applicability Domain: Ensures model credibility and prevents generation into unreliable areas. -
QSP Simulation: Derives from in vitro activity to in vivo efficacy prediction, achieving consideration at the PD level.
Full Summary
This work deeply elucidates how to incorporate PK and Quantitative Systems Pharmacology (QSP) into AI generative drug design. The researchers built an integrated framework: first predicting the affinity of molecules for targets and PK parameters (CL, VDSS, FU) using QSPR models, then embedding them into the multi-objective reinforcement learning phase of DrugEx to guide the birth of new molecules. Finally, the QSP model evaluates the tumor growth inhibition curves of generated molecules to test their true in vivo potential.
The insights brought by this work include:
-
The value of AI large models in drug design is not limited to optimizing target binding; suitable PK/PD indicators can make screening closer to clinical needs. -
QSP models provide forward-looking ideas for quantifying the complex interactions between drugs and physiological pathways, facilitating early screening of new molecules. -
Data quality, model applicability domains, and uncertainties are shortcomings of all AI-driven methods, which need to be supplemented by rigorous methodologies or experimental validations.
Although there are still considerable errors in aspects such as CL prediction in this study, the multi-objective reinforcement learning strategy and QSP simulation ideas can clearly be extended to more targets, more pharmacokinetic parameters, and even toxicity or multiple mechanisms of action, potentially becoming mainstream in AI drug design.
Key Reminder: This study did not reflect any artificially fabricated data in the text; all results are based on real public datasets and literature models; for confirmation, please refer to the source code and original data released by the authors.
Feel free to share and discuss, and please be sure to cite the original source if you need to reference.
GitHub Code Address: https://github.com/CDDLeiden/PK-in-generative-drug-design
For more technical interpretations, please stay tuned. Wishing everyone success in their research!
Q&A Session:
Q1: How is multi-objective reinforcement learning applied to the generation of new compounds in this paper, and how is it combined with pharmacokinetic (PK) prediction? Can you elaborate on the process and its advantages?A: In this paper, the authors utilized DrugEx, a generative model based on RNN (recurrent neural networks), through reinforcement learning (RL) for multi-objective optimization. The entire process can be divided into the following steps:
-
Fine-tuning Phase: First, the pre-trained DrugEx model (trained on a large public library, Papyrus) is fine-tuned on the target dataset to make the generator more inclined towards regions with known activity or known PK data. -
Multi-Objective Reinforcement Learning Phase: Next, the authors convert the predicted property values of the four QSPR models (for A(_{2A})R affinity pKi, CL, VDSS, FU) into reward functions. Specifically, for attributes to be maximized, such as pKi or FU, the larger the predicted value of the molecule for that attribute, the higher the reward; conversely, for attributes to be minimized (such as CL or VDSS in some cases), the lower the value, the higher the reward. -
Applicability Domain Embedding: To prevent the model from generating out-of-domain compounds (structures that have never appeared in the training set), additional positive rewards are set for “in-domain” molecules to ensure the reliability of QSPR model predictions. -
Pareto Front Ranking + Similarity Filtering: DrugEx utilizes the Pareto ranking method to comprehensively score multiple objectives, ranking the compounds generated in the same round and controlling diversity using molecular similarity (Tanimoto distance). This allows for “balancing multiple optimization objectives” while maximizing the coverage of chemical space.
Advantages include:
-
Simultaneously incorporating PK parameters (CL, VDSS, FU) and target affinity pKi allows the generated molecules to consider both “efficacy potential” and “in vivo accessibility” at an early stage. -
Through RL iterative updates, it can continuously reinforce molecular structural patterns that meet multiple objectives and weaken those that do not meet the standards or are outside the domain. -
This process directly considers PK factors in the early design phase of drugs, helping to reduce the risks of later optimization or failure.
Q2: In the paper, the performance evaluation of the QSPR model and applicability domain judgment are mentioned. What are the principles of these evaluation methods? And why use applicability domain?A: The authors first used the QSPRpred tool to build four regression models, targeting A(_{2A})R’s pKi and three major PK parameters (CL, VDSS, FU). To ensure model stability and generalization, the researchers conducted the following evaluations:
-
Cross-Validation and Independent Test Set: The dataset is split into training, validation, and testing parts, and a 5-fold cross-validation is performed to compare the performance of different feature treatments (Morgan fingerprints, RDKit descriptors, etc.) and different learning algorithms (Random Forest, SVM, etc.). Then, the final model performance is evaluated using the independent test set (as shown in Figure 2:
 **(Figure 2 Content)**: The scatter plot compares observed values (X-axis) with predicted values (Y-axis), including results from cross-validation and the test set, showing that A(_{2A})R pKi has the highest fitting degree while CL is the most difficult to predict.
 -
Bootstrapping: Multiple random splits and cluster splits test the model’s robustness when the diversity of compounds changes.
-
Applicability Domain (AD): The authors used the TOPKAT OPS method to evaluate “in-domain” and “out-of-domain” molecules, discovering that in-domain molecules have significantly higher prediction accuracy. The applicability domain assesses whether new molecules exceed the chemical space covered by the training set using methods like principal components or Mahalanobis distance of feature vectors.
-
Preliminary Screening for Multi-Objective Reinforcement Learning: The reason for using the applicability domain is that when we allow the model to “explore” extreme molecules in the RL phase, it may generate structures with extremely rare chemical properties, and the QSPR model’s predictions for these structures are unreliable. Without domain filtering, it could lead to false high or low scores, interfering with the correct optimization of RL.
Q3: The paper includes a table on data preprocessing for the QSPR model, what parameters were included in the search space? How do they affect the final model accuracy?A: The original text in Table 1 (see below) lists the comprehensive data preprocessing and model grid search content, including feature selection, feature filtering, and algorithm hyperparameters, etc. The authors explored different features (MorganFP, RDKit descriptors, etc.), different thresholds (high correlation removal, Boruta filtering, etc.), and different models (Random Forest, SVM, PLS), etc.
|
|
|
|
|
|
|
|
|
|
||
|
|
|
|
|
|
|
|
|
|
|
|
|
|
||
|
|
|
|
|
|
|
|
|
|
|
|
|
|
|
|
Impact:
-
Feature Combination: For instance, Morgan fingerprints focus on local substructure ring neighborhoods, while RDKit descriptors contain overall molecular properties (molecular weight, LogP, HBD/HBA, etc.); choosing different features significantly affects model fitting performance. -
Filtering Thresholds: A too high correlation coefficient threshold retains more features but may cause redundancy; too low risks losing potentially useful information. -
Algorithms and Hyperparameters: The number of trees in Random Forest, the kernel function and penalty coefficient in SVM, etc., affect the balance between overfitting and underfitting. Ultimately, the authors found the optimal combination on different datasets for subsequent reinforcement learning scoring.
Q4: The paper utilizes a Quantitative Systems Pharmacology (QSP) model to simulate the tumor suppression effects of the generated molecules. How is the cross-species scaling formula implemented? Can you show the formula?A: The authors convert the human PK parameters (CL or VDSS) predicted by the QSPR model into parameters for mice to embed the generated compounds into a mouse tumor immune model (based on the research of Voronova et al.). The allometric scaling formula used for cross-species scaling is: where (P) represents the target PK parameter (CL or VDSS), (\alpha) is the power exponent (0.65 for CL, 0.95 for VDSS), and (BW) are the body weights (70 kg for humans and 0.025 kg for mice). This allows the elimination rate constant or volume of distribution predicted in humans to be estimated for mice.
In the QSP model, a one-compartment dosing equation is used: where (Ac2) represents the amount of drug in the central compartment, (Cc2) is the concentration, (k_{el_{ARinh}}) is the elimination rate constant scaled across species, and (Vc) is the volume of the central compartment. Finally, the model will predict the change in tumor volume over time, focusing on the inhibition of adenosine-mediated immune suppression, combined with the PD-L1 antibody setting, as shown in Figure 8:  **(Figure 8 Content)**: Simplified illustration of the effects of immune system components and A(_{2A})R inhibitor concentrations on tumor growth, with red arrows indicating inhibitory effects and green arrows indicating stimulatory effects.
Q5: The results in the paper indicate what chemical space distribution differences arise from optimizing PK parameters and target affinity? Why is it said that single optimization may sometimes not lead to better tumor suppression?A: The authors found through analysis of physicochemical property distributions and UMAP projections (see Figure 5) that:
-
If both A(_{2A})R pKi and FU are maximized, the model tends to generate structures with lower LogP, smaller molecular weight, and higher sp(^3) carbon ratio; consistent with real molecules that have high FU. -
If maximizing CL, it will also produce structures with lower molecular weight and higher polarity to speed up the clearance in the body; if minimizing CL, it will generate regions with larger, more hydrophobic molecules. -
UMAP Visualization clearly shows the aggregation of different objectives in corresponding ranges of the dataset, as shown in the heat maps of the last few rows in Figure 5: 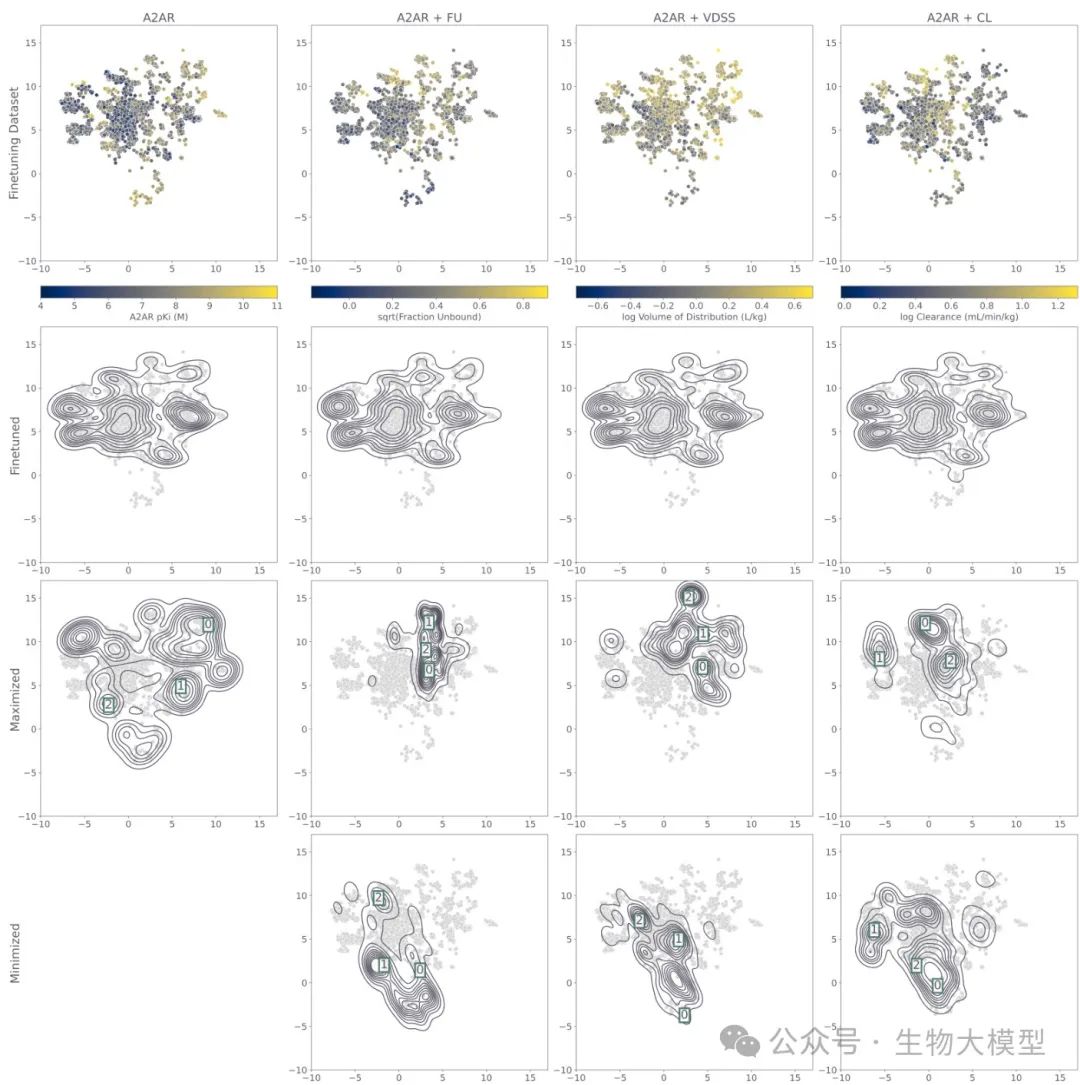 **(Figure 5 Content)**: UMAP visualization, with the third and fourth rows below showing the molecular distribution heat maps under dual-objective optimization scenarios.
However, in the QSP model simulation results, the authors found that if only improving a certain PK attribute or affinity while sacrificing others, it does not necessarily lead to optimal tumor suppression:
-
High affinity + high clearance rate: The drug concentration drops quickly, possibly not allowing sufficient time to effectively inhibit A(_{2A})R; -
Low affinity + low clearance rate: Although the exposure time is long, the inhibition strength is insufficient, making it difficult to achieve a significant improvement in efficacy.
Therefore, in complex biological systems, multi-objective integration (considering both exposure and affinity) is necessary to ensure effective intervention of the drug on immune pathways, which is the advantage advocated by the paper.
The above are the five key Q&A regarding the technical aspects of the paper, which may help readers interested in this research gain a deeper understanding of the core principles and operational details of the method. For further understanding of the entire experimental process, source code, and complete equations of the QSP model, please refer to the original text and its appendix.
https://doi.org/10.26434/chemrxiv-2025-77hg5