Follow us丨Free book giveaway at the end
1
Do you know what the core driving force of artificial intelligence is?
The scale and speed of data and information generation today make it difficult for organizations to effectively gain valuable insights from a vast amount of information and different sources. We rely on Google, Amazon, Alexa, and other chatbots because they help us find information and take action in ways that align with how we typically think about things. As businesses explore next-generation scalable data management approaches, leveraging advanced capabilities like automation has become a competitive advantage.
Think about how businesses have undergone multiple powerful technological transformations. Despite developing business cases, strategies, and long-term implementation roadmaps, many people still often fail to achieve or embrace change.
Limited understanding of business applications and use cases leads to an inability to define a clear vision and strategy.
When selecting the most relevant and cost-effective business use cases and supporting rapid validation, not knowing where to start is common.
Multiple initiatives across the organization are not streamlined or optimized for the enterprise.
Enterprise data and information are distinct, redundant, and not easily usable.
Lack of necessary skills and training.
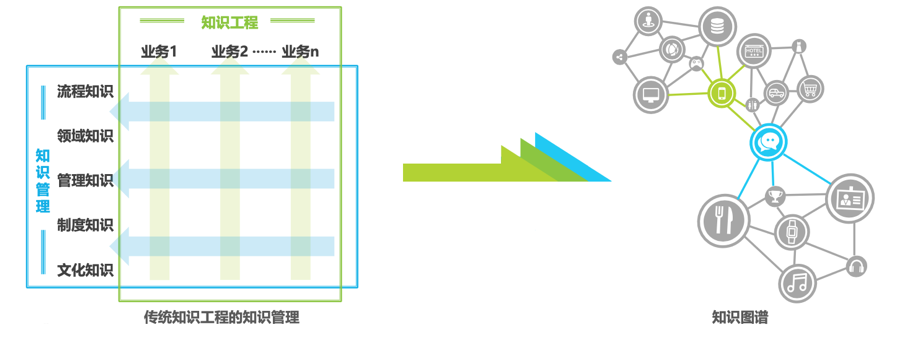
Most enterprises are already developing or leveraging knowledge graphs to enhance their knowledge, data, and information management. Typically, these functions belong to existing roles or positions within the organization, such as data science or engineering, business analysis, information management, or data operations.
However, given the technological advancements in today’s work and market, and the increasing value of organizational knowledge and data, leaders who view information and data as assets and make strategic investments to enhance and optimize these information and data are beginning to reap rewards, allowing their employees to focus on more value-added tasks and contribute to complex analytical work that builds the business.
The most pragmatic approach to developing a custom strategy and roadmap for knowledge graphs is to first look at existing capabilities and foundational strengths in data and information management practices, such as metadata, taxonomies, ontologies, and knowledge graphs, as these will serve as foundational pillars for artificial intelligence.
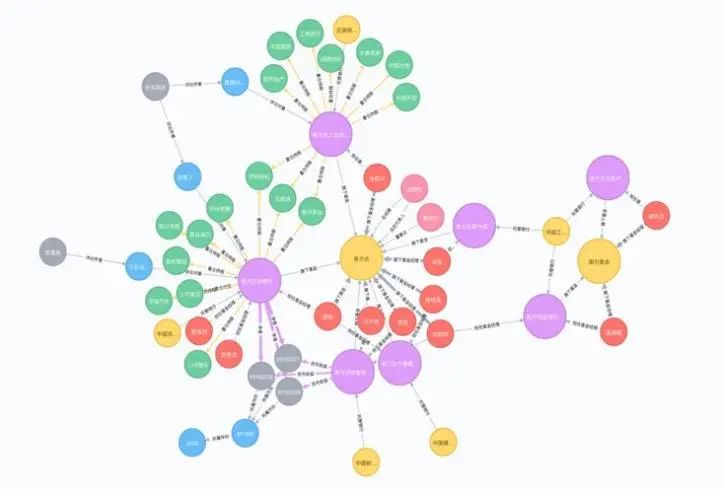
Image source: Google Images
2
What is a Knowledge Graph?
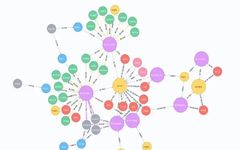
A knowledge graph is a large-scale semantic network that uses graph models to describe knowledge and model the relationships between everything in the world. It is one of the important ways to represent knowledge in the big data era. The most common representation of a knowledge graph is RDF (triples), which is a collection of “entity x relationship x another entity” or “entity x attribute x attribute value” sets, where nodes represent entities (entity) or concepts (concept), and edges represent various semantic relationships between entities/concepts.
Because knowledge graphs are rich in information such as entities, concepts, attributes, and relationships, they make it possible for machines to understand and interpret the real world.
In the 1970s and 80s, traditional knowledge engineering and expert systems solved many problems, but they succeeded only in clearly defined, bounded, and closed application scenarios that heavily relied on expert intervention. Once open-ended issues were involved, it became nearly impossible to implement, making it difficult to adapt to the demands of open applications at scale in the big data era.
Compared to traditional knowledge representation, knowledge graphs have characteristics such as large scale, rich semantics, high quality, and user-friendly structure, marking the entry of knowledge engineering into a new era.
3
Application Areas of Knowledge Graphs
The application areas of knowledge graphs can be divided into four aspects: Good Governance, Benefiting the People, Promoting Industry, and Intelligent Integration.
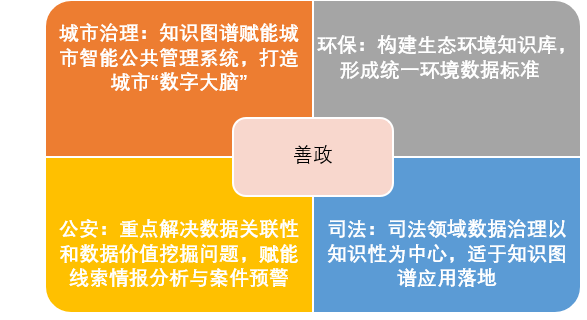
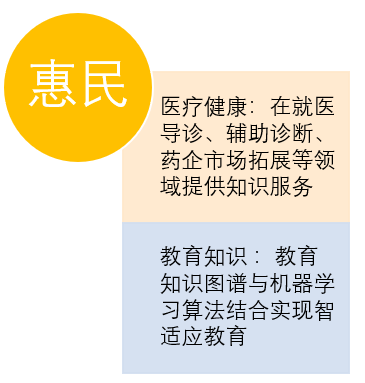
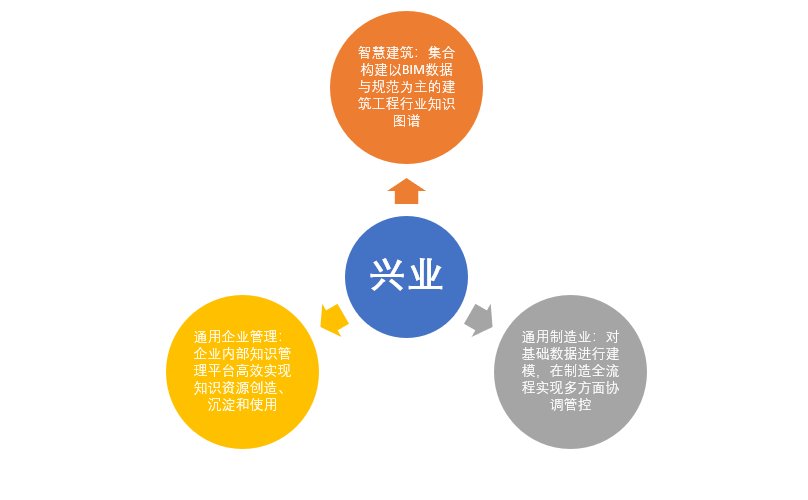
Source: AI-oriented 2020
Knowledge Graph Industry White Paper of “New Infrastructure”
4
Salary of Knowledge Graph Engineers
The application areas of knowledge graphs are very broad, and more importantly, knowledge graphs are the ultimate linking engine for enterprise data management and the driving force of new methods in artificial intelligence. So, for all the engineers, do you want to know what the salary of knowledge graph engineers is?
According to incomplete statistics as of August 23, 2021, the average salary of knowledge graph engineers is 33.1K/month, with 71.3% of people earning between 30K-50K per month.
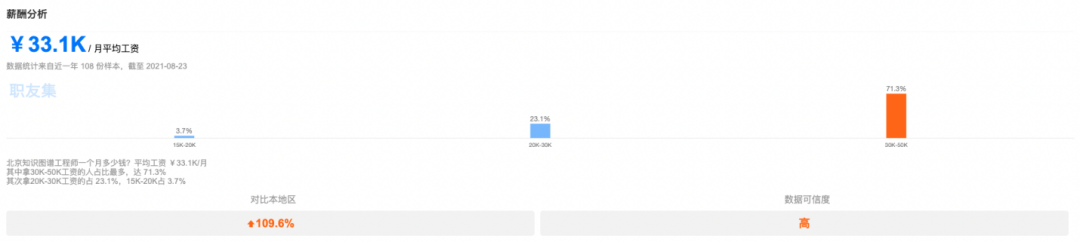
Data Source: Job Friend
From the historical salary data changes, from 2016 to 2021, the salary of knowledge graph engineers has shown a rising trend, and with the explosion of knowledge graph applications in various fields, the salary of knowledge graph engineers will continue to rise, making it a very competitive position.
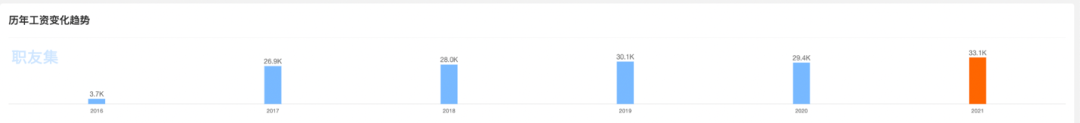
Data Source: Job Friend
Knowledge graph engineers in various regions earn salaries that far exceed the average salary in that city, proving that both the nation and enterprises are beginning to focus on the future applications of knowledge graphs, indicating that this field will have limitless development directions.

Data Source: Job Friend
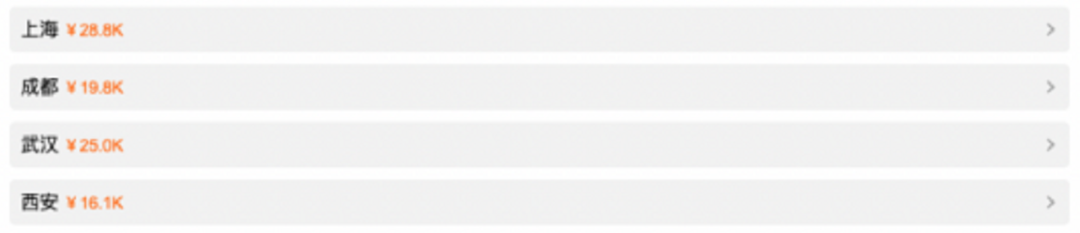
Data Source: Job Friend
5
Top Ten Steps to Build a Knowledge Graph
The core of the knowledge graph is its ability to coordinate and link structured and unstructured data, resulting in higher data quality that is very suitable for machine learning.
By using knowledge graphs, one can benefit from precise search and analysis, semantic data catalogs, deep text analysis, agile data integration, and other applications. Adding tools and data to information management practices, such as semantic metadata enrichment, taxonomies, and ontologies, will also provide a perfect foundation for many AI applications.
Despite the increasing adoption of knowledge graphs across various industries for better enterprise knowledge management, data, and content analysis, there is no universal method to build them.
Therefore, here are the general ten steps to build a knowledge graph:
-
Clarify business and expert requirements: Identify the goals for data collection and define the questions you want to answer.
-
Collect and analyze relevant data: Discover which datasets, taxonomies, and other information (proprietary, open, or commercially available) are best suited to achieve goals related to domains, scope, sources, maintenance, etc.
-
Clean data to ensure data quality: Correct any data quality issues to make the data suitable for its tasks. This includes removing invalid or meaningless entries, adjusting data fields to accommodate multiple values, fixing inconsistencies, etc.
-
Create a semantic data model: Thoroughly analyze different data patterns to prepare for data coordination. Reuse or design ontologies, application profiles, RDF shapes, or other mechanisms on how to use them together. Use standards like RDF Schema and OWL to formalize data models.
-
Integrate data with ETL or virtualization: Apply ETL tools to transform data into RDF or access it using data virtualization through NoETL, OBDA, GraphQL Federation, etc. Generate semantic metadata to make data easier to update, discover, and reuse.
-
Coordinate data through alignment, merging, and harmonization: Match descriptions of the same entity in overlapping datasets, process their attributes to merge information, and map their different taxonomies.
-
Build a data management and search layer: Perfectly merge different graphs using RDF data models. For locally stored data, GraphDB™ can effectively enforce the semantics of data models through reasoning, consistency checks, and validation. It can scale in clusters and synchronize with search engines like Elasticsearch to meet expected usage and performance requirements.
-
Augment the graph through reasoning, analysis, and text analysis: Enrich data by extracting new entities and relationships from text. Apply reasoning and graph analysis to discover new information. Now the data contained in the graph is more than the sum of its constituent datasets, also possessing better interconnectivity, leading to more content and deeper analysis.
-
Maximize the availability of data: Start providing answers to original questions through various knowledge discovery tools (such as powerful SPARQL queries, user-friendly GraphQL interfaces, semantic searches, faceted searches, data visualizations, etc.). Additionally, ensure that the data is fair (findable, accessible, interoperable, and reusable).
-
Make the KG easy to maintain and evolve: Finally, after creating the knowledge graph and people start using it, keep it alive by setting up maintenance routines — the way it evolves and updates from different sources will consume while maintaining high data quality.
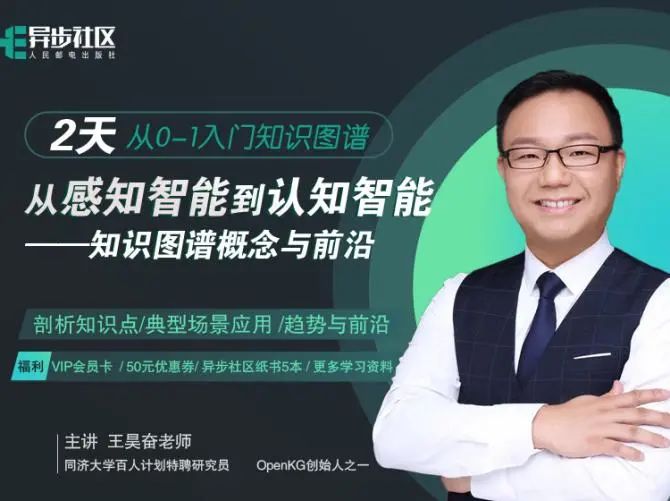
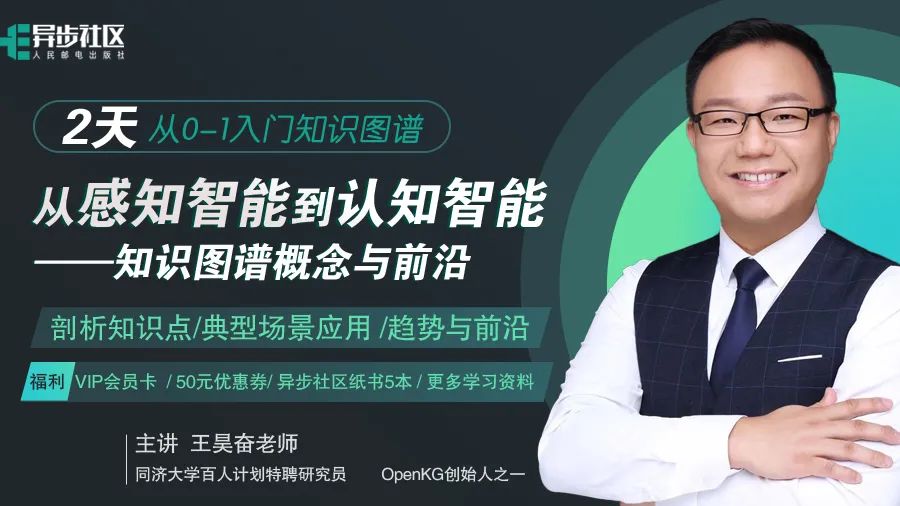
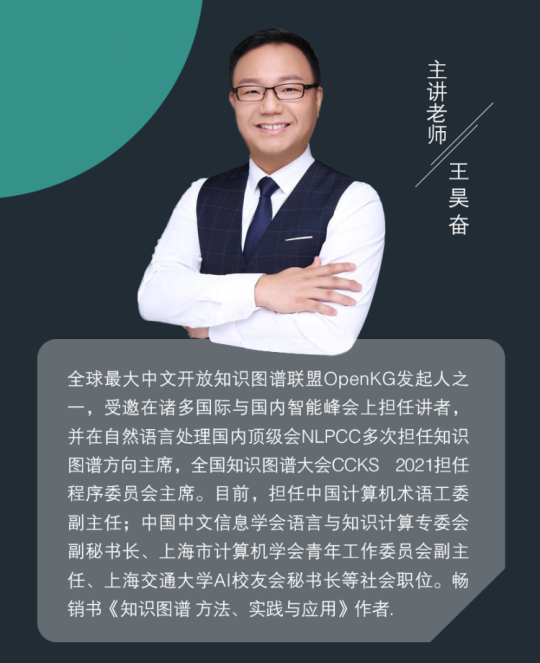
Finally, if you want to learn more about the basics of knowledge graphs, Professor Wang Haofen, a distinguished researcher in the hundred-person plan at Tongji University and one of the founders of OpenKG, will take you from 0 to 1 in knowledge graphs over two days, mastering the concepts and cutting-edge content from perceptual intelligence to cognitive intelligence.
Featured Lecturer👇
▼
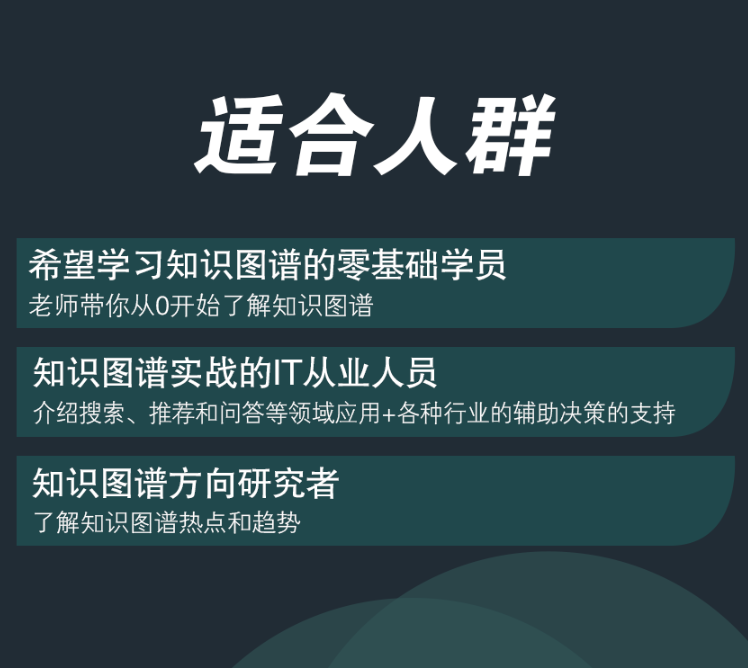
Target Audience👇
▼
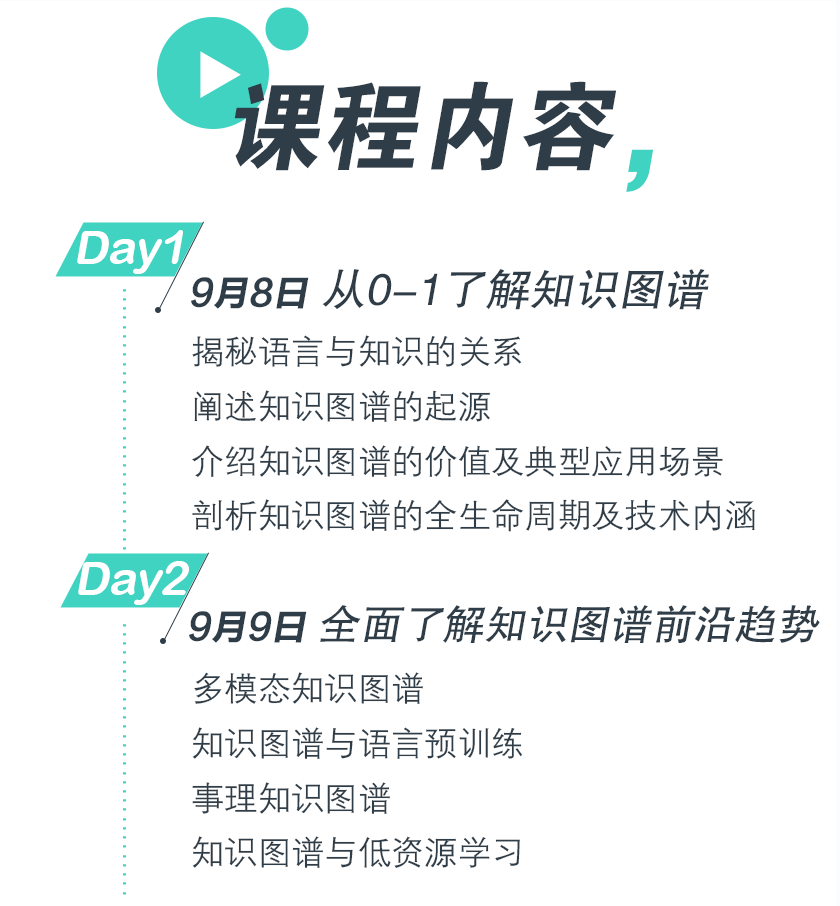
Course Content👇
▼
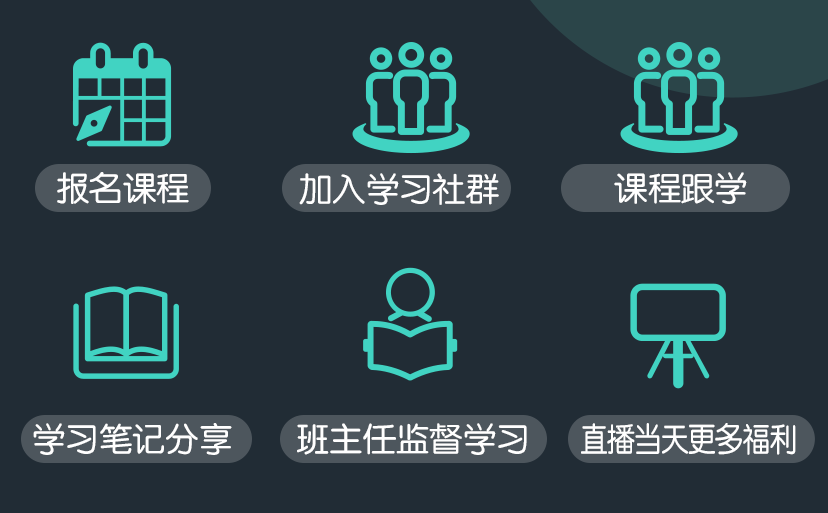
Enrollment Guide👇
▼
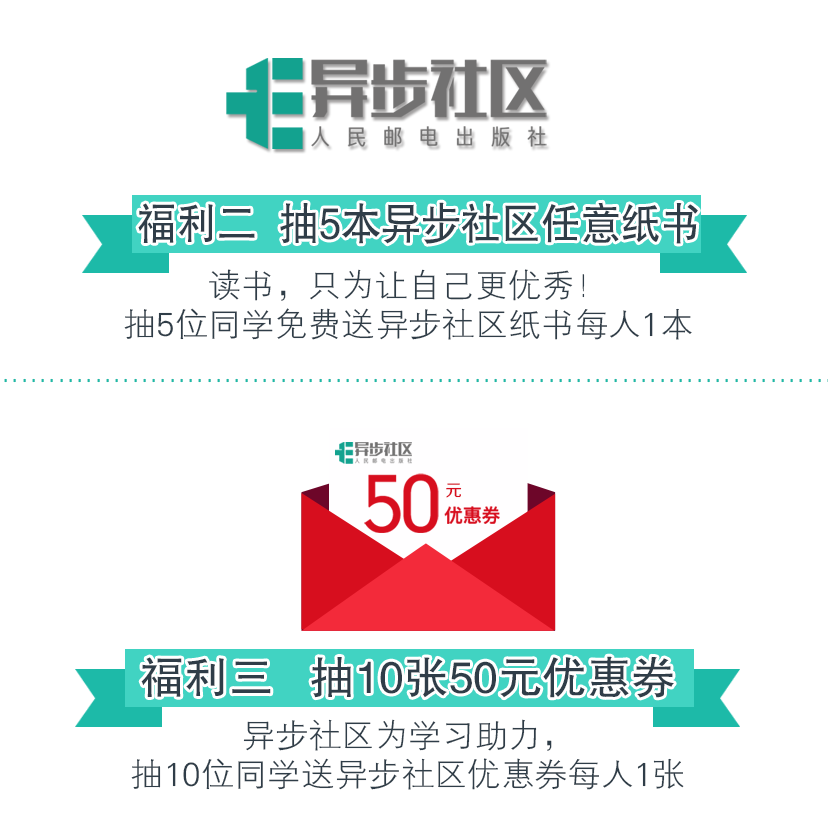
Live Course – Continuous Benefits👇
▼

Scan the QR code below and note “KG03”
To receive free course benefits

Professor Wang Haofen will lead you
From 0 to 1 in knowledge graphs
Limited-time offer of 0.1 yuan to learn!
Live session starts on September 8! Hurry up!