1. The Role of Prediction and Classification in Machine Learning
-
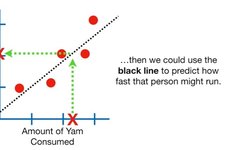
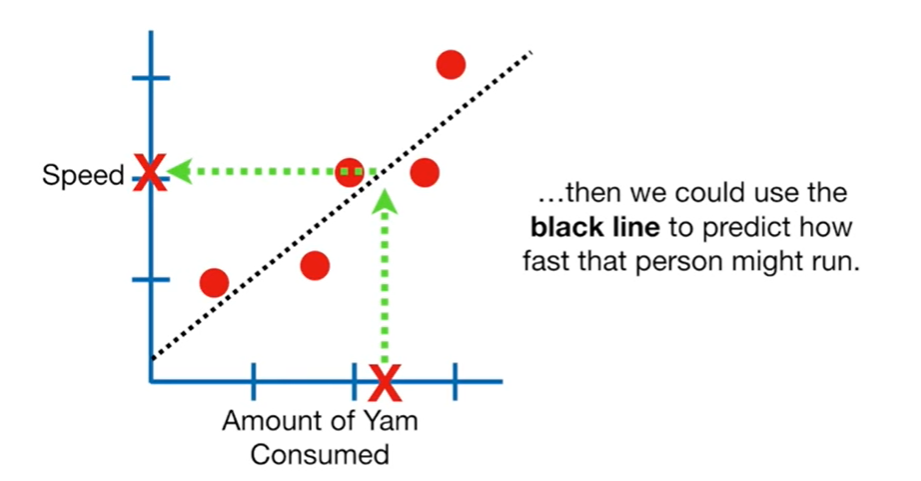
For example, the predictive role of the linear regression model. In the following example, the x-axis represents people’s salt intake, and the y-axis represents their running speed. Based on existing data, machine learning can use the least squares method or other methods to fit the best line model. When a new sample appears, knowing its salt intake allows us to infer its running speed. This is the predictive role of machine learning.
-
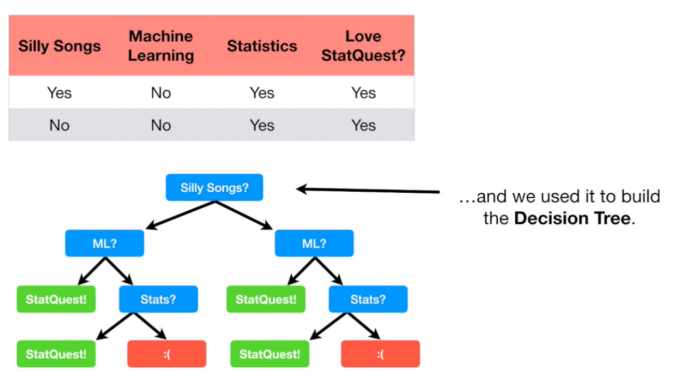
For example, the classification role of decision trees. The video suggests that based on a series of questions, decision trees can classify whether people like StatQuest. The decision tree will classify whether people like StatQuest based on a series of judgment nodes.
-
Many other models can be used for prediction and classification. In machine learning, besides linear models and decision trees, there are many complex and advanced methods, such as deep learning convolutional neural networks or other interesting models. The development of machine learning methods is rapid, with new methods emerging almost every year. Regardless of the model, its performance in testing is very important, meaning that the model’s extrapolation ability is crucial.
2. Training and Testing Datasets in Machine Learning
-
Training Data: The Role is to Train the Model. The author believes that the significance of training data is to provide a new machine with a batch of data, allowing it to learn patterns from the data, thereby achieving the purpose of machine learning and training.
-
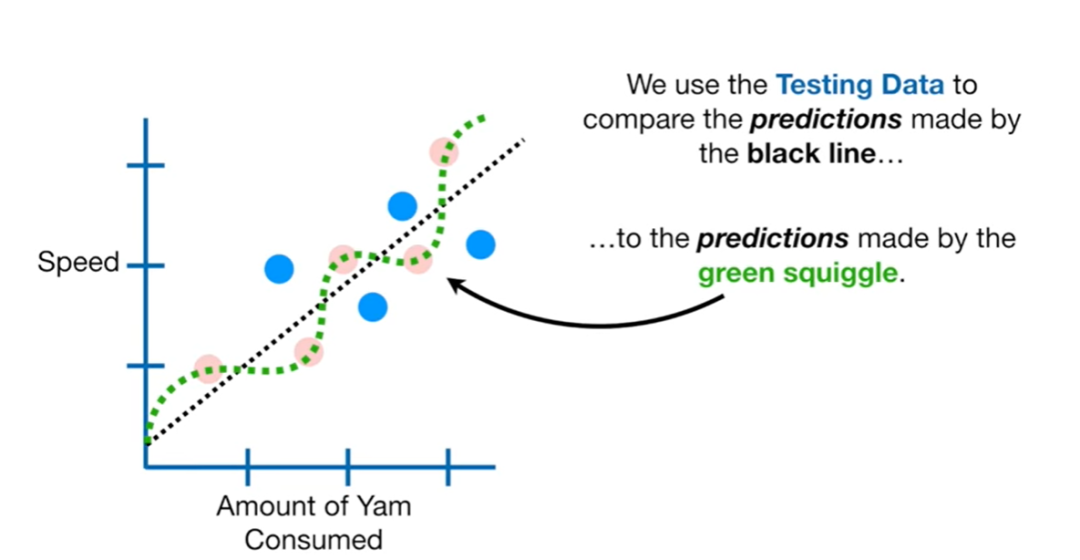
Testing Data: The Role is to Test the Model and Validate its Generalization. The author believes that testing data is a different batch of data from the training data, applying the learned patterns to new data to validate the generalization of the new machine.
-
The Significance of Training Data → Testing Data: In machine learning, we first need to train the model on the training data to find a suitable model; then, we test that model on the testing data to evaluate its effectiveness. If the model performs poorly on the testing data, it indicates that the model’s conclusions are limited to the training data, and it has no generalization ability.
3. Why Separate Training and Testing Sets?
-
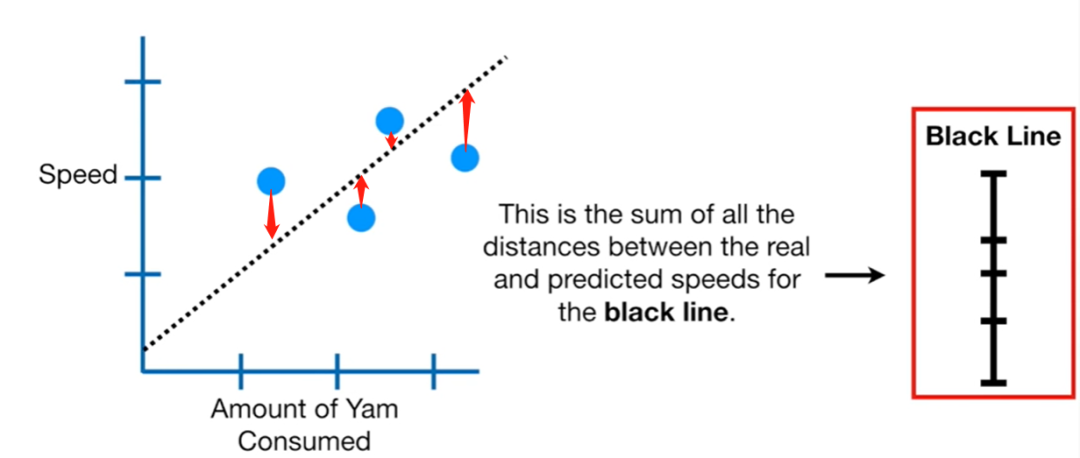
In the straight line model (black dashed line), based on people’s salt intake, we predict their running speed. We calculate the absolute sum of the differences between the predicted speed and the real speed, which is the sum of residuals.
-
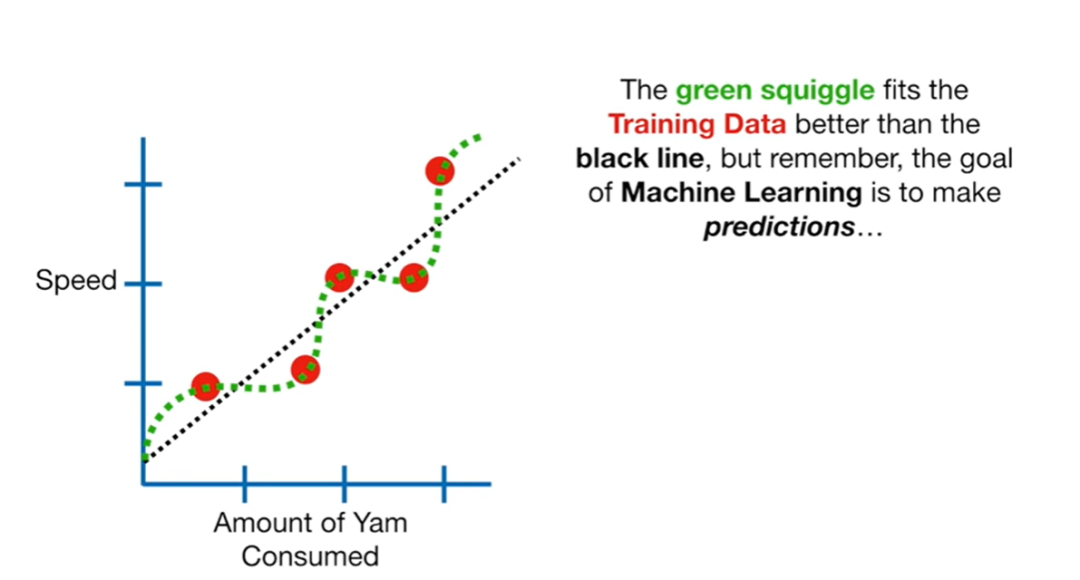
Similarly, in the curve model (green dashed line), based on people’s salt intake, we predict their running speed. We calculate the absolute sum of the differences between the predicted speed and the real speed, which is the sum of residuals.
-
Comparison of performance in the testing dataset between the straight line model (black dashed line) and the curve model (green dashed line): comparing the sum of residuals for the two models. The sum of residuals for the green curve > the sum of residuals for the black line, indicating that the green curve performs worse in the testing data than the black line.

4. Bias-Variance Tradeoff
-
Performing well in training samples but poorly in testing samples is known as the bias-variance tradeoff; keep this knowledge point in mind, as we will delve deeper into it later. -
In practical machine learning, we need to consider the machine’s performance on the training dataset and its generalization effect on the testing dataset.
5. Summary
Editor: Lü Qiong
Reviewer: Luo Peng