OpenObserve is an open-source, high-performance cloud-native observability platform (logs, metrics, tracing) developed in Rust. Compared to Elasticsearch, it can save about 140 times the storage cost. OpenObserve can handle PB-level data, making it a great tool to try if you are looking for an observability tool for logs, metrics, and tracing. Although OpenObserve is currently in the alpha stage, it has undergone extensive testing.
Comparison of OpenObserve and Elasticsearch
Elasticsearch is a general-purpose search engine that can be used for application search or log search. OpenObserve is built specifically for log search. If you are looking for a lightweight alternative to Elasticsearch, you should consider ZincSearch. If you just want a log search engine, then OpenObserve is a very good choice.
OpenObserve does not rely on data indexing; it stores unindexed data in a compressed format on local disks or in object storage in parquet column format. This significantly reduces the computational requirements during data ingestion, and the compression ratio is very high, resulting in a storage cost reduction of about 140 times. The lack of data indexing means that full scans may be slower than Elasticsearch, but thanks to various other techniques like partitioning and caching, it should still be fast. Uber found that 80% of queries in their production environment are aggregation queries, and OpenObserve’s columnar data storage means aggregation queries are typically much faster than Elasticsearch.
Below are the results when we used Fluentbit to send real log data from the Kubernetes cluster to Elasticsearch and OpenObserve, which only concerns storage. The cost of EBS volumes is $0.08/GB/month (GP3), while the cost of S3 is $0.023/GB/month. In Elasticsearch’s HA mode, there is usually one primary node and two replicas. There is no need to replicate S3 to achieve data persistence/availability, as AWS redundantly stores your objects across multiple devices in at least three availability zones (AZ) in the Amazon S3 region.
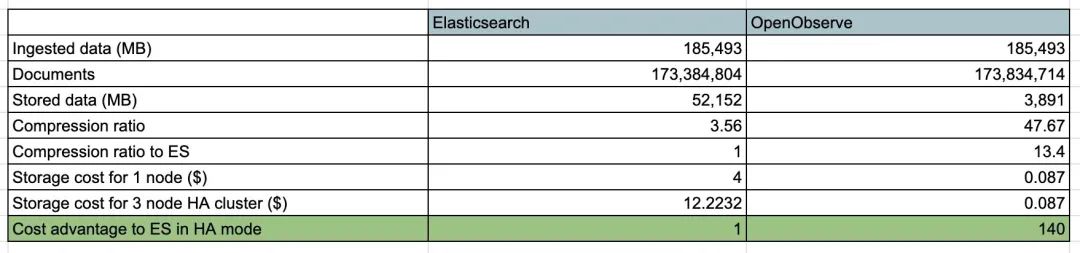
In the above scenario, OpenObserve has a significant advantage with a storage cost that is 140 times lower than Elasticsearch, not even considering the additional unused EBS volume capacity (which needs to be provisioned to avoid running out of disk space) and the ongoing monitoring of disk usage to prevent it from filling up.
The stateless node architecture allows OpenObserve to scale horizontally without worrying about data replication or corruption. Compared to Elasticsearch, you will typically find that the operational workload and costs of managing an OpenObserve cluster are much lower.
The built-in graphical user interface of OpenObserve eliminates the need for other components like Kibana, and thanks to the advantages of Rust, it performs excellently without facing the issues that come with JVM.
Compared to Elasticsearch, which is a general-purpose search engine that also has observability tool functions, OpenObserve is built from the ground up as an observability tool, focusing on providing excellent observability performance.
Architecture
OpenObserve can run in single-node mode or in a cluster in HA mode.
Single Node Mode
Single node mode is divided into several architectures, primarily differing in the method of data storage, with the following main types:
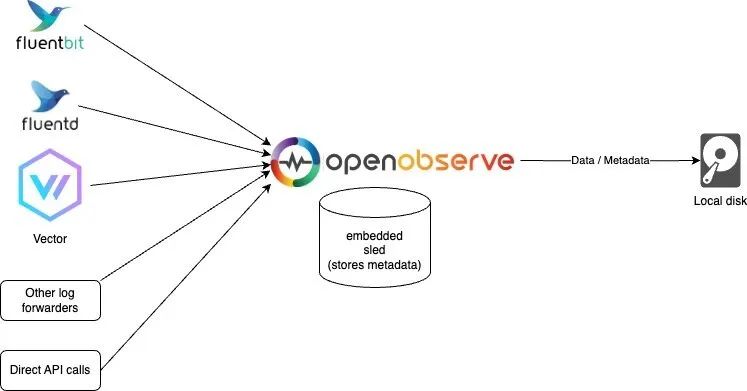
Sled and Local Disk Mode
If you only need to perform simple usage and testing, or if high availability is not a requirement, you can use this mode. Of course, you can still process over 2 TB of data daily on a single machine. In our tests, using the default configuration, the processing speed on a Mac M2 was about 31 MB/sec, processing 1.8 GB per minute and 2.6 TB per day. This mode is also the default mode for running OpenObserve.
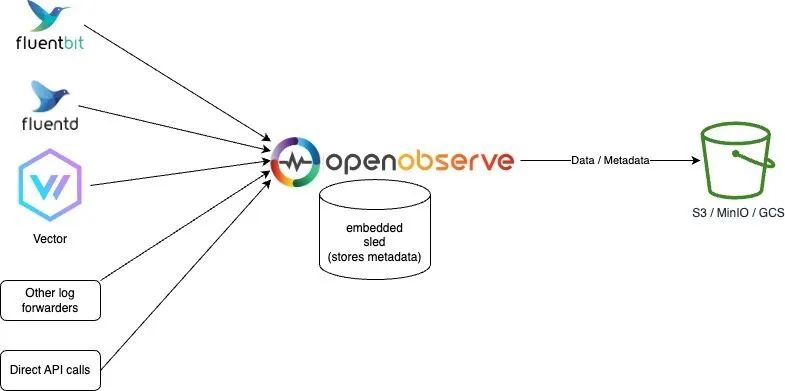
Sled and Object Storage Mode
This mode is essentially the same as OpenObserve’s default mode, except that the data is stored in object storage, which better supports high availability since the data will not be lost.
Etcd and Object Storage Mode
This mode uses Etcd to store metadata, while the data is still stored in object storage.
HA Mode
HA mode does not support local disk storage; in cluster mode, OpenObserve will run multiple nodes, each of which is stateless, with data stored in object storage and metadata stored in Etcd, which better supports high availability since the data will not be lost.
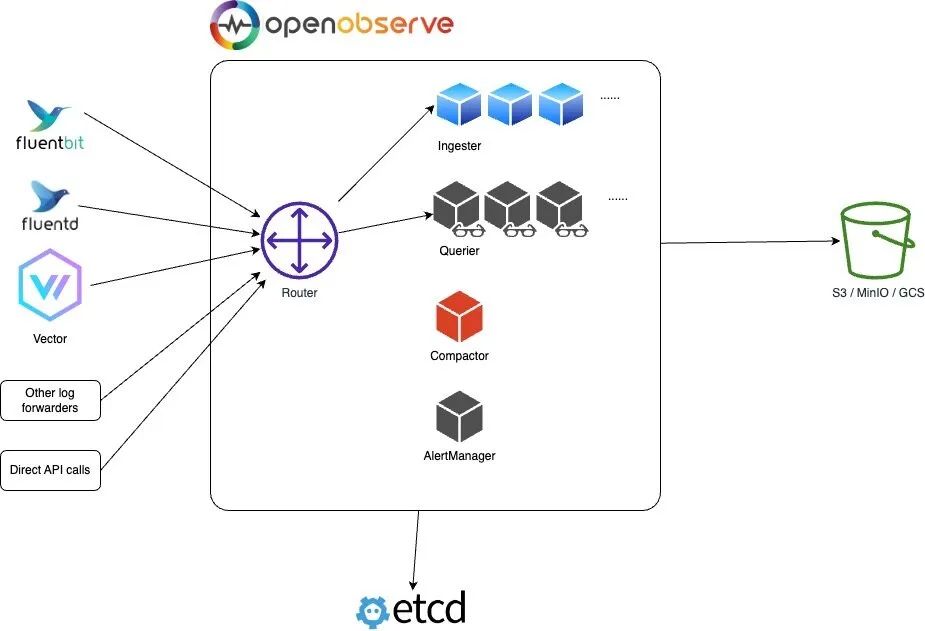
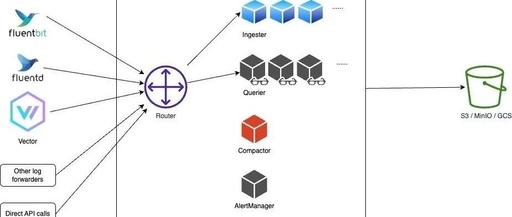
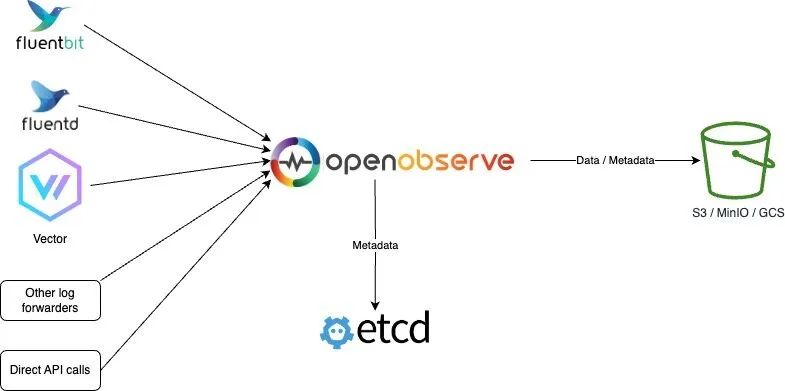
In this mode, OpenObserve mainly includes four components: Router, Querier, Ingester, and Compactor, all of which can be scaled horizontally; Etcd is used to store metadata such as user, function, alert rules, and cluster node information; object storage (such as S3, MinIO, GCS, etc.) stores all data including parquet files and file list indexes.
-
Router: The Routerroutes requests to the ingester or querier and provides a UI interface through the browser. The Router is essentially a very simple proxy that sends appropriate requests and responses between the data ingestion program and the query program. -
Ingester: The Ingesterreceives ingestion requests and converts data intoparquetformat before storing it in object storage. They temporarily store data inWALbefore transferring it to object storage. -
Querier: The Querieris used to query data; the querier node is completely stateless. -
Compactor: The Compactormerges small files into larger files to make searching more efficient. TheCompactoralso handles data retention policies, full stream deletion, and file list index updates.
Installation
Installing OpenObserve is very simple; just download the binary file. It supports Linux, Windows, and macOS, and also supports Docker images. We will install it in the Kubernetes cluster, and for simplicity, we will use the default Sled and local disk mode.
First, create a namespace:
$ kubectl create ns openobserve
Then create the resource manifest file as shown below:
# openobserve.yaml
apiVersion: v1
kind: Service
metadata:
  name: openobserve
  namespace: openobserve
spec:
  clusterIP: None
  selector:
    app: openobserve
  ports:
    - name: http
      port: 5080
      targetPort: 5080
---
# create statefulset
apiVersion: apps/v1
kind: StatefulSet
metadata:
  name: openobserve
  namespace: openobserve
  labels:
    app: openobserve
spec:
  serviceName: openobserve
  replicas: 1
  selector:
    matchLabels:
      app: openobserve
  template:
    metadata:
      labels:
        app: openobserve
    spec:
      securityContext:
        fsGroup: 2000
        runAsUser: 10000
        runAsGroup: 3000
        runAsNonRoot: true
      containers:
        - name: openobserve
          image: public.ecr.aws/zinclabs/openobserve:latest
          env:
            - name: ZO_ROOT_USER_EMAIL # Specify admin email
              value: [email protected]
            - name: ZO_ROOT_USER_PASSWORD # Specify admin password
              value: root321
            - name: ZO_DATA_DIR
              value: /data
          imagePullPolicy: Always
          resources:
            limits:
              cpu: 4096m
              memory: 2048Mi
            requests:
              cpu: 256m
              memory: 50Mi
          ports:
            - containerPort: 5080
              name: http
          volumeMounts:
            - name: data
              mountPath: /data
  volumeClaimTemplates:
    - metadata:
        name: data
      spec:
        accessModes:
          - ReadWriteOnce
        storageClassName: cfsauto # Specify an available storage class
        resources:
          requests:
            storage: 10Gi
In the above resource manifest, we used a StatefulSet to create OpenObserve. Note that you need to configure the ZO_ROOT_USER_EMAIL and ZO_ROOT_USER_PASSWORD environment variables to specify the admin email and password. Then specify an available StorageClass in the PVC template for persistent data storage.
Then simply apply the above resource manifest file:
$ kubectl apply -f openobserve.yaml
$ kubectl get pods -n openobserve
NAME            READY   STATUS    RESTARTS   AGE
openobserve-0   1/1     Running   0          2m31s
$ kubectl get svc -n openobserve
NAME          TYPE        CLUSTER-IP   EXTERNAL-IP   PORT(S)    AGE
openobserve   ClusterIP   None         <none>        5080/TCP   2m52s
Quick Usage
After creation, we can check the OpenObserve logs to verify if it started successfully:
$ kubectl logs -f openobserve-0 -n openobserve
[2023-08-04T10:18:06Z INFO  openobserve] Starting OpenObserve v0.5.1
[2023-08-04T10:18:06Z INFO  openobserve::service::db::user] get; org_id=Some("default") name="[email protected]"
[2023-08-04T10:18:06Z INFO  tracing::span] set;
[2023-08-04T10:18:06Z INFO  openobserve::service::db::user] Users Cached
# ......
[2023-08-04T10:18:06Z INFO  openobserve::common::meta::telemetry] sending event OpenObserve - Starting server
[2023-08-04T10:18:07Z INFO  actix_server::builder] starting 4 workers
[2023-08-04T10:18:07Z INFO  actix_server::server] Tokio runtime found; starting in existing Tokio runtime
[2023-08-04T10:18:07Z INFO  openobserve] starting HTTP server at: 0.0.0.0:5080, thread_id: 0
[2023-08-04T10:18:07Z INFO  openobserve] starting HTTP server at: 0.0.0.0:5080, thread_id: 0
[2023-08-04T10:18:07Z INFO  openobserve] starting HTTP server at: 0.0.0.0:5080, thread_id: 0
After starting, we can use the kubectl port-forward command to map OpenObserve’s port 5080 to the local machine, and then access http://localhost:5080 in the browser to see the OpenObserve UI.
$ kubectl port-forward svc/openobserve 5080:5080 -n openobserve
Forwarding from 127.0.0.1:5080 -> 5080
Forwarding from [::1]:5080 -> 5080
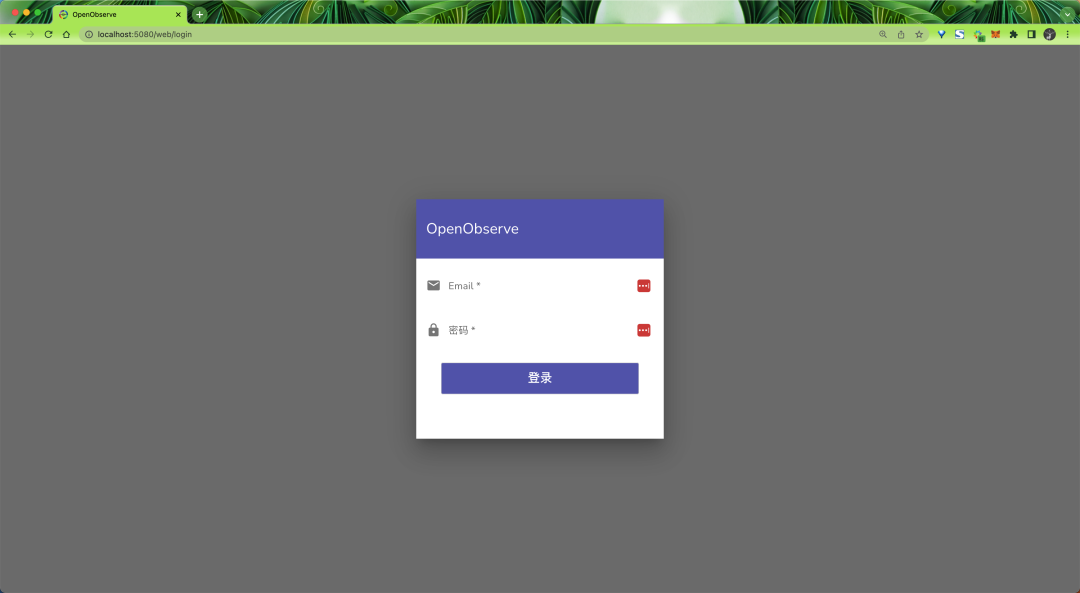
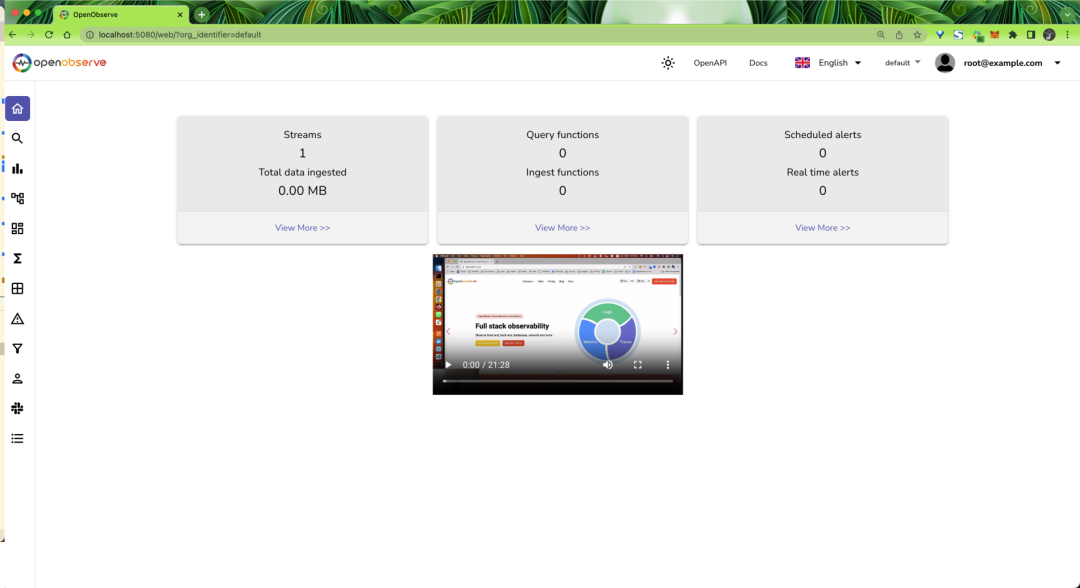
Log in using the admin email and password specified above, and you will see the main interface of OpenObserve:
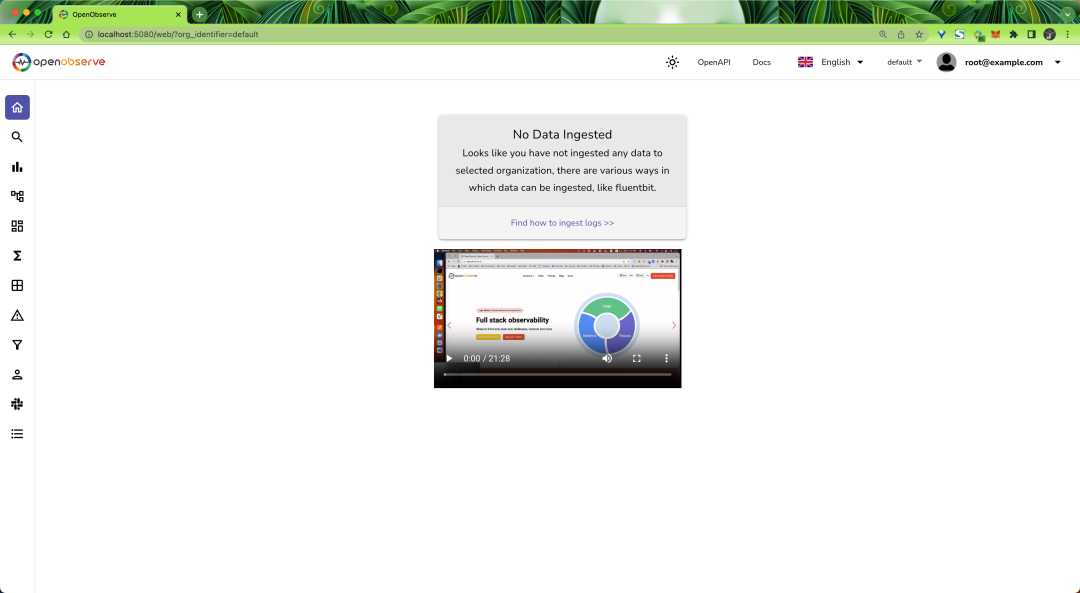
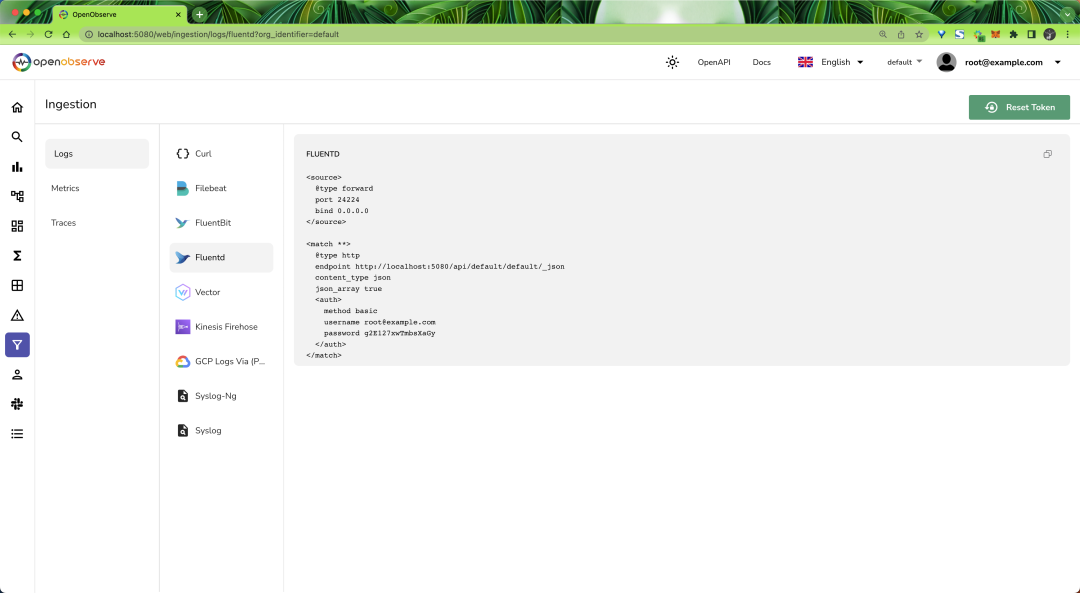
Since there is currently no data, there is nothing on the page. The ingestion page provides various ingestion methods for Logs, Metrics, and Traces data:
Here, we can first use the JSON API to load some sample log data to understand how to use OpenObserve. First, use the command below to download the sample log data:
$ curl -L https://zinc-public-data.s3.us-west-2.amazonaws.com/zinc-enl/sample-k8s-logs/k8slog_json.json.zip -o k8slog_json.json.zip
$ unzip k8slog_json.json.zip
Then use the command below to import the sample log data into OpenObserve:
$ curl http://localhost:5080/api/default/default/_json -i -u "[email protected]:root321"  -d "@k8slog_json.json"
HTTP/1.1 100 Continue

HTTP/1.1 200 OK
content-length: 71
vary: Origin, Access-Control-Request-Method, Access-Control-Request-Headers
content-type: application/json
date: Fri, 04 Aug 2023 10:46:46 GMT

{"code":200,"status":[{"name":"default","successful":3846,"failed":0}]}
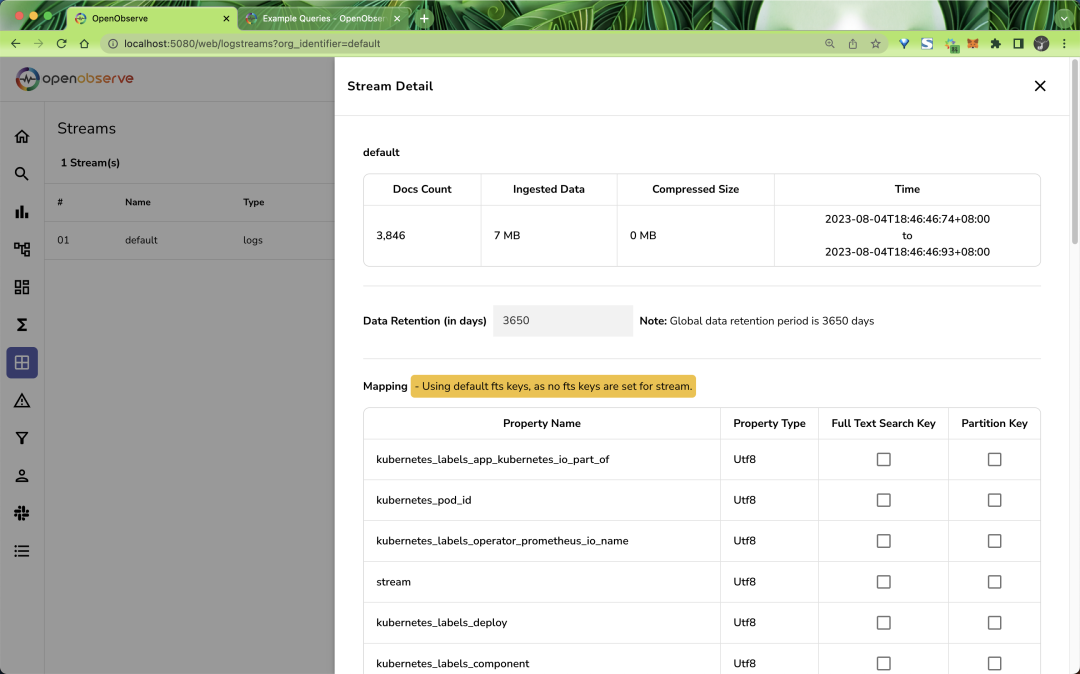
After successfully importing the receipts, refresh the page to see data:
In the Stream page, you can see the metadata of the data we imported:
Then you can switch to the Logs page to see the log data:
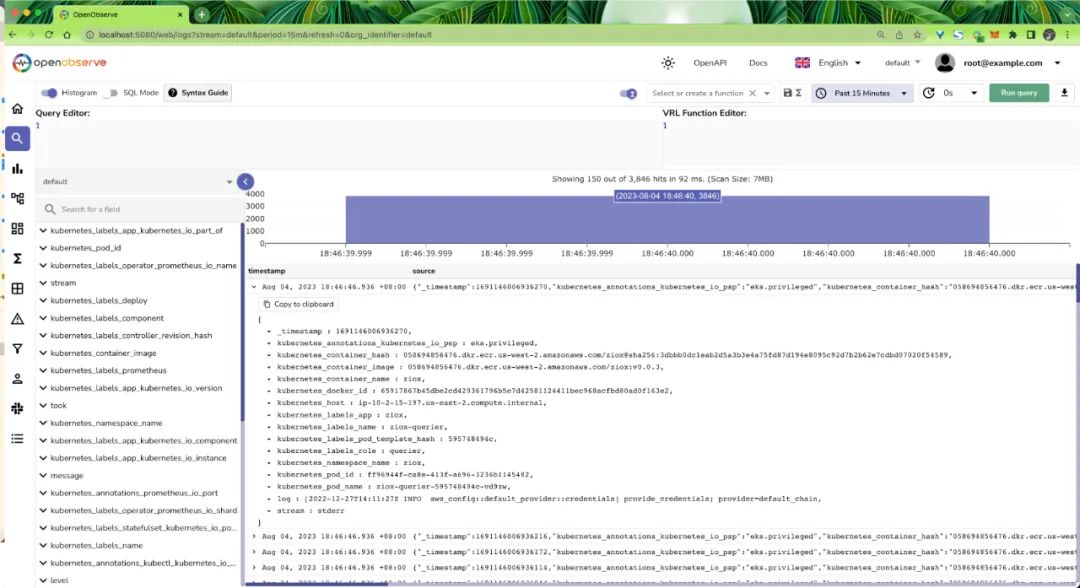
Now you can query the logs based on direct needs, with some commonly used query syntax as shown:
-
For a full-text search for the value error, usematch_all('error')in the query editor. -
For a case-insensitive full-text search for the value error, usematch_all_ignore_case('error'). -
For a column search for the value error, usestr_match(fieldname, 'error'), which is more efficient thanmatch_allbecause it searches within a single field. -
To search for the value 200 in the codecolumn, usecode=200. -
To search for the value stderrin thestreamcolumn, usestream='stderr'. -
To search on the log logcolumn and use the query functionextract_ip, useextract_ip(log) | code=200.
Of course, in addition to logs, OpenObserve also supports metrics and tracing data, which will not be demonstrated here; interested users can try it themselves.
This is just a simple demonstration of how to use OpenObserve for logs. In the future, we can use tools like Fluentbit and Vector to send log data from Kubernetes clusters to OpenObserve. Stay tuned!
Reference documentation: https://openobserve.ai/docs