Without high-quality data, there are no high-quality data mining results. Missing data values are one of the common issues encountered in data analysis.
When the proportion of missing data is very small, missing records can be directly discarded or handled manually. However, in actual data, missing data often accounts for a significant proportion. In this case, manual handling is very inefficient, and discarding missing records would result in a loss of a large amount of information, causing systematic differences between incomplete and complete observation data. Analyzing such data may lead to incorrect conclusions.
Therefore, it is essential to fill in missing values using specialized methods. Below are several commonly used methods for filling in missing values, along with Python processing code.
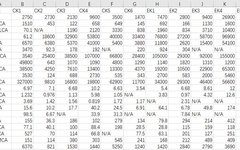
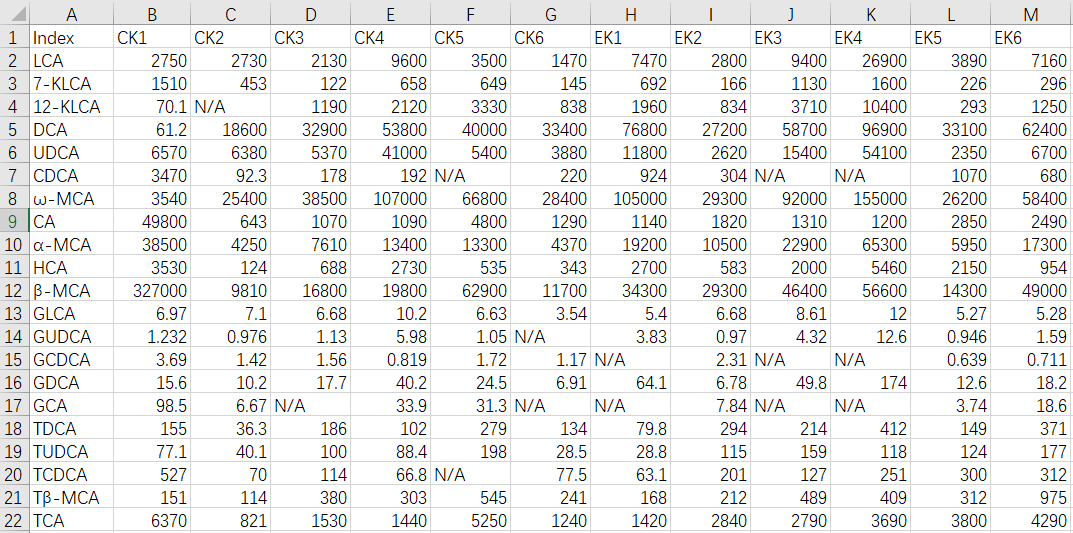
The sample data is a set of bile acid content data for metabolites, and here is a preview of the data:
 1
1
Fill with Fixed Values
One common method for filling missing feature values is to use fixed values, such as 0, 9999, -9999, etc.

2
Fill with Previous and Next Data
For each missing value, fill it with the values of the previous and next data.

3
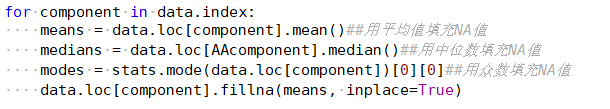
Fill with Mean, Mode, or Median
Filling missing values based on the similarity between samples means using the most likely values to fill them. Usually, values that represent the central tendency of the variable are used for filling, such as mean, median, and mode. So which indicators should we use to fill in missing values?
| Distribution Type | Fill Value | Reason |
|---|---|---|
| Approximately Normal Distribution | Mean |
All observation values are well clustered around the mean. |
|
Skewed Distribution |
Median |
Most values of skewed distribution cluster on one side of the variable distribution, and the median is a better representative of the data’s central tendency. |
|
Distribution with Outliers |
Median |
The median is a better representative of the data’s central tendency. |
|
Nominal Variable |
Mode |
Nominal variables have no size or order, and cannot be added, subtracted, multiplied, or divided. For example, gender. |
4
Interpolation Method
Interpolation is an important method for approximating discrete functions. It can estimate the approximate values of the function at other points based on the values at a finite number of points. Unlike fitting, the curve must pass through all known data. Below is an example of using interpolation to fill in missing values with the average of the previous and next values.

5
Fill with KNN Data
Fill with data from the nearest neighbors. The so-called K-nearest neighbors, first use KNN to calculate the k closest data points, then fill in their mean.

6
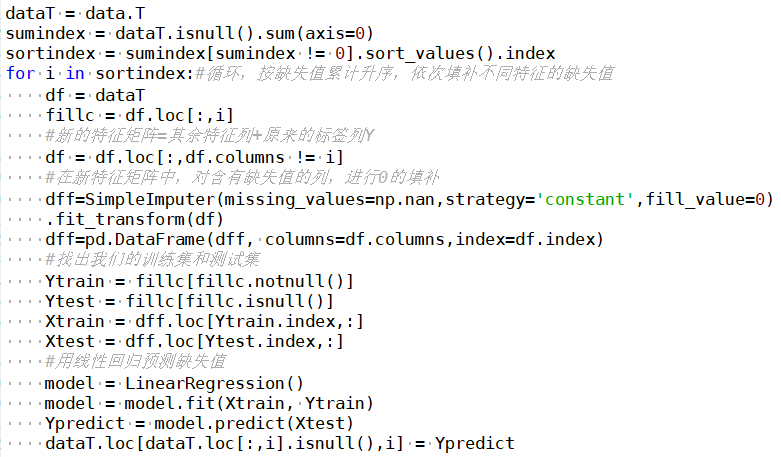
Regression
Any regression learns from the feature matrix and then solves for the continuous label y. This process can be realized because regression algorithms believe there is a certain relationship between the feature matrix and the labels. For data with n features, if feature T has missing values, treat feature T as the label and the other n-1 features as a new feature matrix. Use the parts of T that have no missing values corresponding to the new feature matrix to predict the missing parts of T’s label. Common regression models – linear regression, establish regression equations based on the complete dataset. For objects containing null values, substitute known attribute values into the equation to estimate unknown attribute values, and use these estimated values for filling.
7
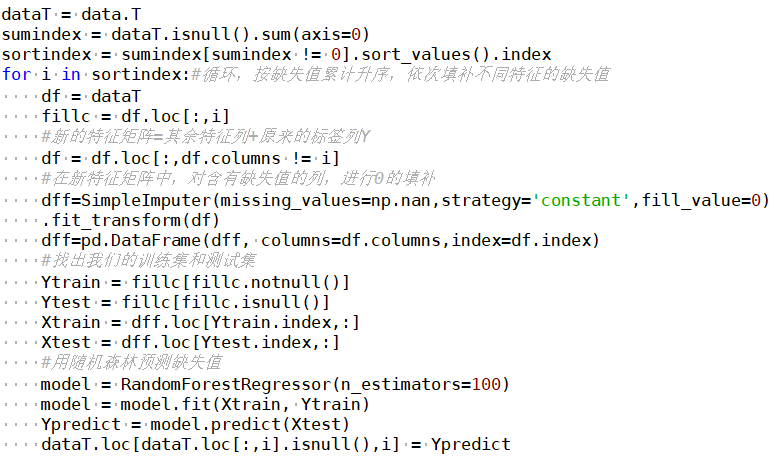
Random Forest
Random forests can also be applied to regression problems, depending on whether each CART tree in the random forest is a classification tree or a regression tree. It performs many bootstrap samples on the original dataset to obtain many different datasets, and then builds a decision tree for each dataset. The final result of the random forest is the average of the results from all trees, and for a new observation, n predictions are obtained through many trees (e.g., n trees), and the final result is filled with the average of these n predictions. Of course, it is still similar to the regression data preprocessing above, first constructing the training set and prediction set before making model predictions.
 Summary
The above are several common methods for filling missing values. The specific filling method should also be based on the data type and biological significance.
Reference Articles
Common Missing Value Filling Methods
https://github.com/AHNU/fill_missing_values
sklearn Machine Learning: Random Forest Regressor RandomForestRegressor
https://blog.csdn.net/gracejpw/article/details/102611273?utm_medium=distribute.pc_aggpage_search_result.none-task-blog-2~all~top_click~default-1-102611273.nonecase

99% of metabolomics researchers are reading the following:
●Looking for a job? Want to switch jobs? We have helped you discover the “treasure company”.
●New Mechanism | The microbiome + metabolites tell you why too much salt can lead to hypertension?
● Benefits Release | Overview of Research Ideas and Analysis of Landmark Cases (Five)
●J Hepatol | Oxidized Lipids Tapped “You”: Screening Disease Biomarkers Pick Me!
●Revealing: Can 16-Year-Old Plasma Samples Still Be Used for Metabolomics Research?


Contact Number: 027-62433042
WeChat: 18062045271
Email: [email protected]
Website: www.metware.cn
I know you are “watching”
