
▲Click “ZiMu UXD” to follow, reply “Design Circle” to join us

2022 Year Original Total No. 15
40 articles to meet the annual target, 25 articles left
(Full text 4282 words, estimated reading time: 6 minutes)
In recent years, low-code has become a popular field, allowing development to be completed with little or no coding through a “Lego building block” assembly method. The advantages are also obvious, improving product development efficiency and enabling users without development capabilities to get started quickly.
In the field of data modeling, to accurately predict future outcomes, business analysts need to have professional data analysis methods and even coding skills. This poses a significant challenge for operational and marketing personnel.
Amazon SageMaker provides the Canvas service, allowing business analysts to generate accurate machine learning (ML) predictions without writing any code or requiring ML expertise, through a visual and click-based interaction method. It sounds impressive, but what is the actual experience like? Today we will evaluate it.
The structure of the article is as follows:
1. User scenarios, the pain of data modeling
2. User needs, the workflow of business analysts
3. Product interaction, building refined experience design
4. Visual style, shaping a lightweight design language
5. Scenario expansion, promoting experience upgrades
6. Suggestions for optimizing product experience
1. User Scenario Analysis
When it comes to terms like “data modeling, data prediction, data analysis,” it can easily intimidate ordinary users.
As a beginner user, I am also an experience designer now engaged in data product design. When I first entered the industry, I felt a significant discomfort with business information due to the high industry threshold, which is not easily understood by ordinary users. For business analysts, they also face the threshold of data modeling.
We can imagine a scenario.
Business analyst A wants to conduct data analysis, but due to limited personal capabilities, facing complex and variable data sets is time-consuming and labor-intensive. They can only use Excel to complete simple data visualization, but the inherent connections and degrees of mutual influence in the data are difficult to analyze, so they need to seek help from a professional data analyst.
Contacting data analyst C, the two begin face-to-face communication.
A: C, I have a set of customer data and want to predict their future loan possibilities. Each user has about 20 indicators. What should I do?
C: Oh, this is simple, you can balabala……~ A: ……(completely confused~) C, can you explain it more simply? C: You can first….. then….. A: C, can you help me implement this? C: Sure, but I’m quite busy lately, and it will take some time to handle this request. Please submit a request form to me. A: ……
At this moment, A must be feeling overwhelmed.
I believe many business analysts encounter such scenarios. How can we help business analysts without professional coding skills obtain the desired prediction results? Is this possible?
2. User Needs
B-end products must focus on user needs and solve user problems. Therefore, it is essential to understand who the users are and what their needs are.
Let’s introduce one of the user groups for the Canvas service—business analysts.
Business analysts need to discover future opportunities through existing data. For example, a bank’s business analyst needs to identify target customers for upcoming marketing campaigns by predicting which customers are most likely to register for certificates of deposit based on datasets that include customer demographics and banking history. Alternatively, how can a business analyst help the marketing outbound team find users more willing to answer calls through the analysis of customer data, thereby improving the marketing team’s efficiency? These are important tasks for business analysts.
The daily work of business analysts may involve the following processes:

① Data Preparation
The data analyst receives a dataset that includes data from different channels or tables to merge and organize. Based on their experience, they will remove duplicate or invalid field information to improve the quality of the original data.
② Data Processing
Using professional data analysis tools or writing code to complete data predictions. If the results are not satisfactory, they need to repeatedly adjust the data model. This stage usually takes a long time, as analysts essentially go through trial and error to find a reasonable data model.
③ Result Presentation
After completing data processing, they still need to present the impact weight of the data on the results through various data charts, etc.
In ordinary enterprises, there are usually no professional business analysts, and the results are predicted by operational or marketing personnel. These personnel generally do not have professional data modeling capabilities and can only perform simple processing of datasets using Excel or analysis software. If it is a prediction of future data, simple data analysis cannot meet work needs.
Additionally, from the perspective of the enterprise, after establishing a basic model, business analysts hope to further optimize the data model to improve the accuracy of data predictions, turning the model into the enterprise’s data asset to provide greater value. Therefore, it is necessary to hand over the data model completed by analysts to professional data scientists for further optimization.
Thus, the user needs for such a product are:
a. Simplicity, maximizing the reduction of skill thresholds for the product;
b. Efficiency, allowing users to quickly obtain predictive data;
c. Collaboration, turning models into company assets.
3. Product Experience Design Analysis
Compared to traditional business analysts, those in the internet age face not a scarcity of data, but an overabundance of data. Therefore, data analysts must learn to leverage technology to efficiently process data. More importantly, business analysts need to continuously innovate and break through in the methodology of data research.
From the perspective of experience design, I have summarized the following points:
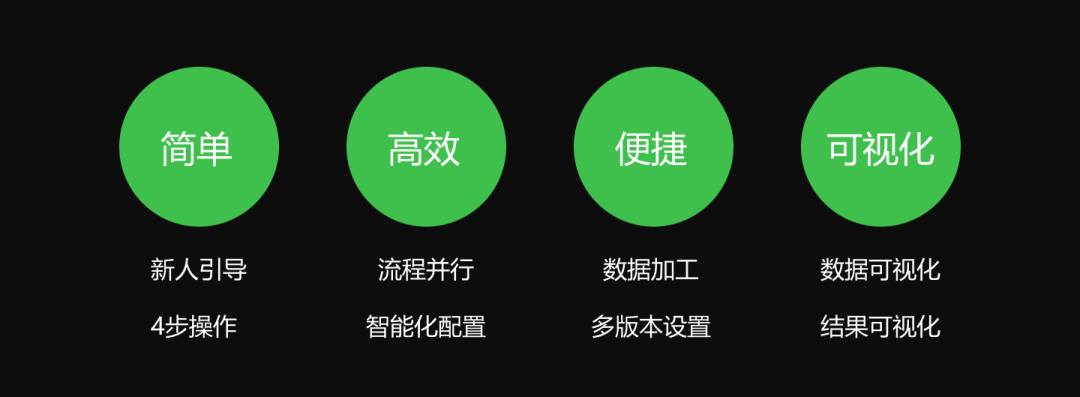
1. Simple and Easy to Operate
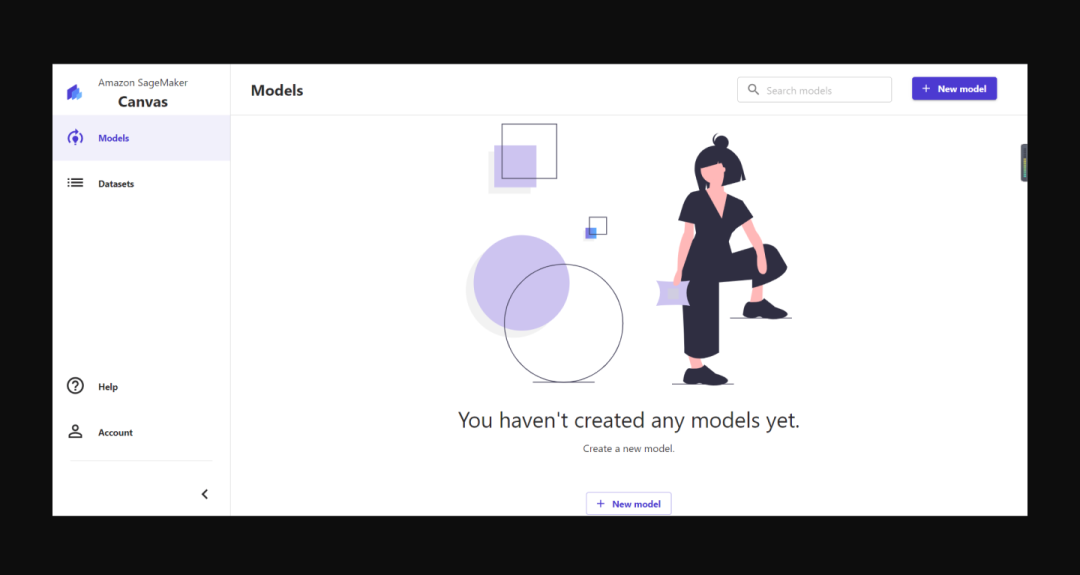
Canvas empowers ordinary business personnel with modeling capabilities. As long as you have data and needs, you can create your own model by uploading data and obtain predictive results. Furthermore, you can share the model information with professional data scientists for further optimization. Thus, the first impression from the evaluation is “simple.”
(1) Newcomer Guidance
To reduce the learning cost for users, newcomer guidance is essential. Through simple guidance, users can quickly get started.
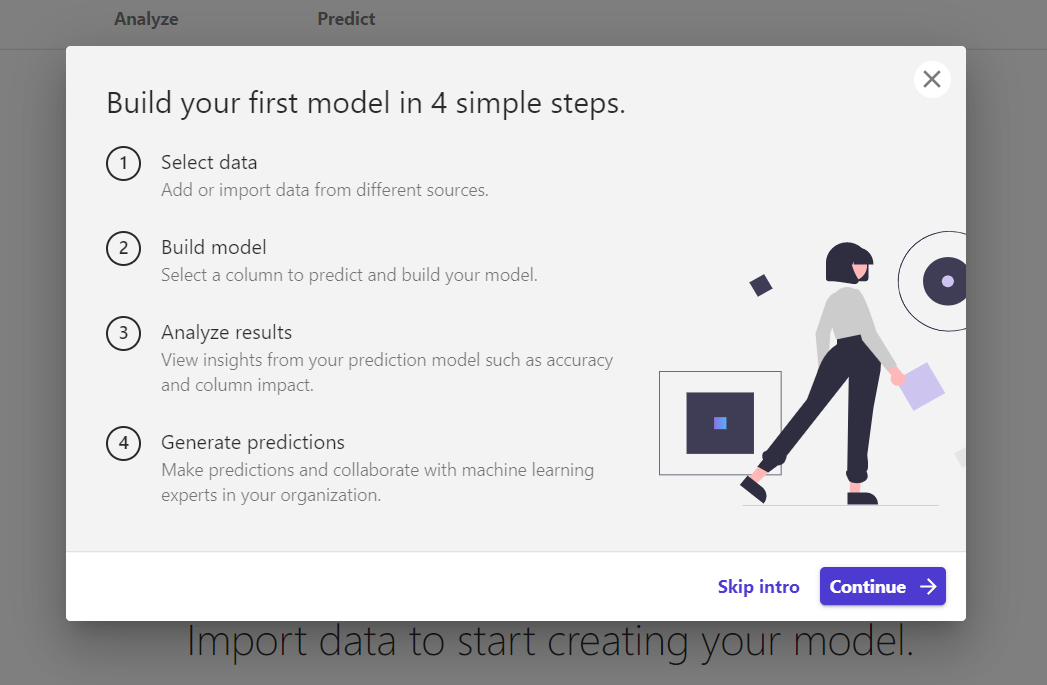
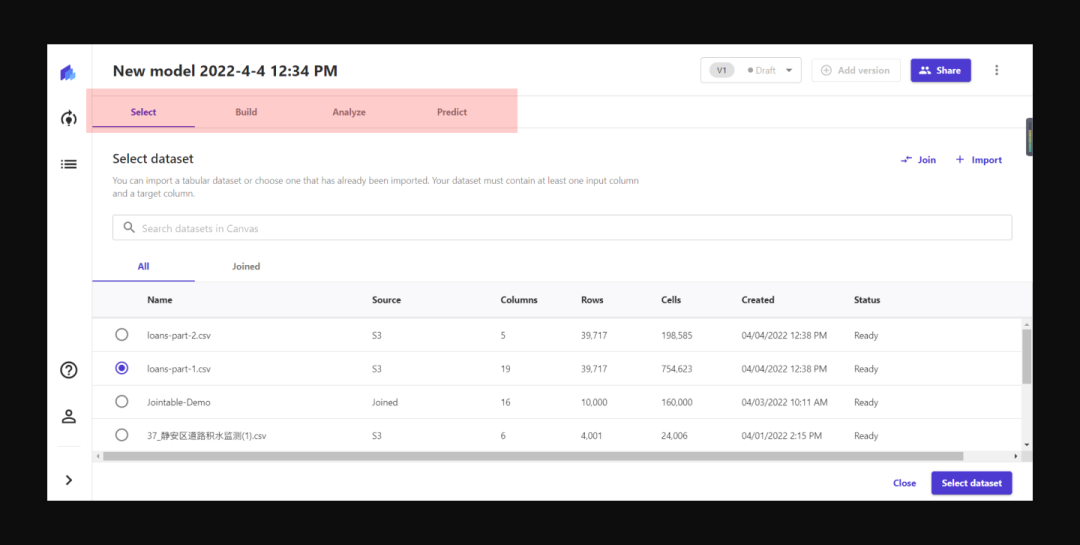
(2) Simple Process
Business analysts only need to optimize and process the data, upload it to Canvas, and through a simple four-step operation, they can complete data prediction. This greatly improves the efficiency and accuracy of users’ work.
2. Enhancing User Efficiency
(1) Parallel Processes
Although Canvas has a step-by-step process, there is no mandatory requirement between steps. This means you do not need to complete the previous step to click to view the next step. Since building a model may take 2-15 minutes, users can review data information, construction methods, and other information to check for missing or incorrectly configured information.
Additionally, during the model creation process, users can close the current workflow and let it run in the background, achieving multi-task parallel operation. Users can continue to create or review other data models, thus maximizing efficiency.
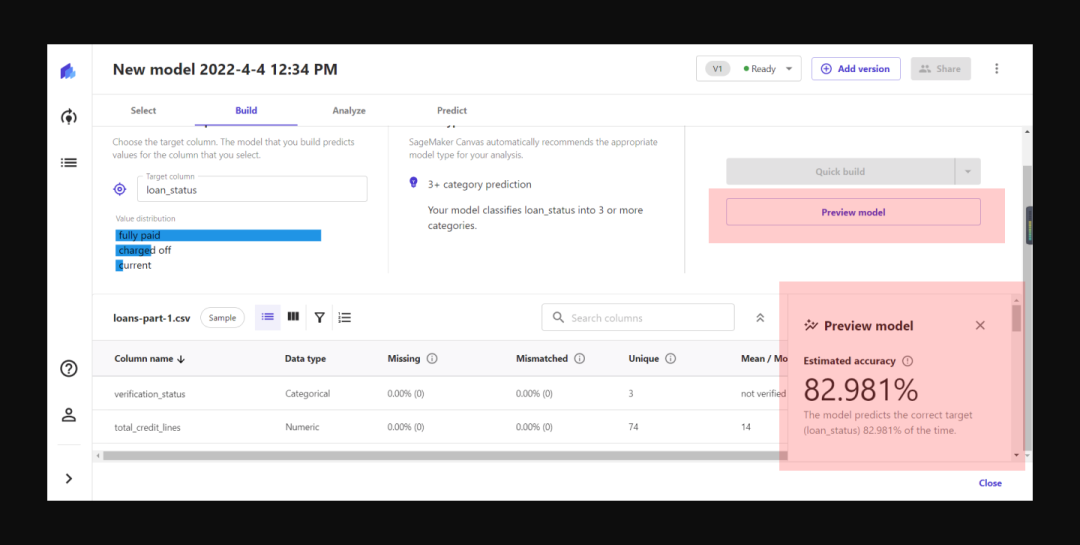
(2) Preview Mode
Before starting model computation, Canvas provides a preview of the computation results, preventing users from wasting time without obtaining the desired results. Moreover, the result preview provides users with a basis for reverse screening data, allowing beginner users to make model predictions without it being a blind box. This reduces users’ unnecessary trial and error and enhances their confidence.
3. Convenient, Reducing Unnecessary User Exits
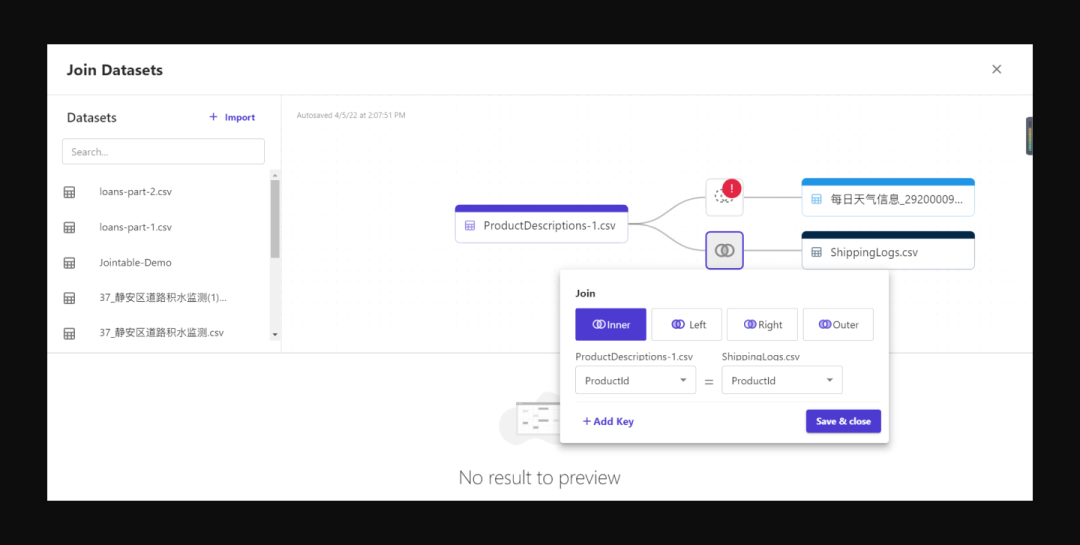
(1) Intelligent Data Configuration
Considering that users need to perform secondary processing on data, Canvas provides data connection functionality, enabling users to combine and optimize multiple data sources to establish new data. The system can automatically determine whether the data has relevance and specify the connection method.
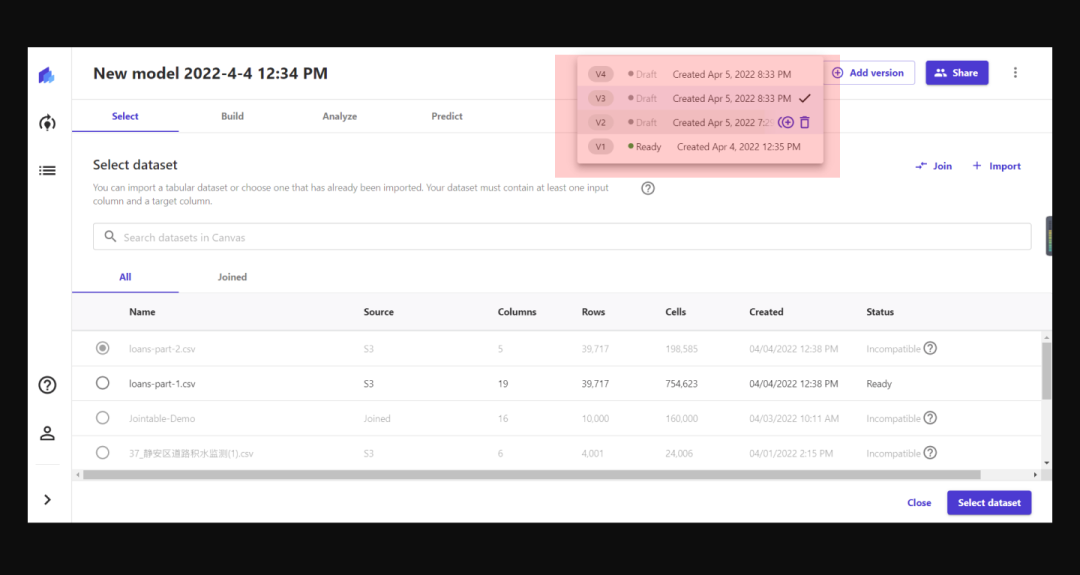
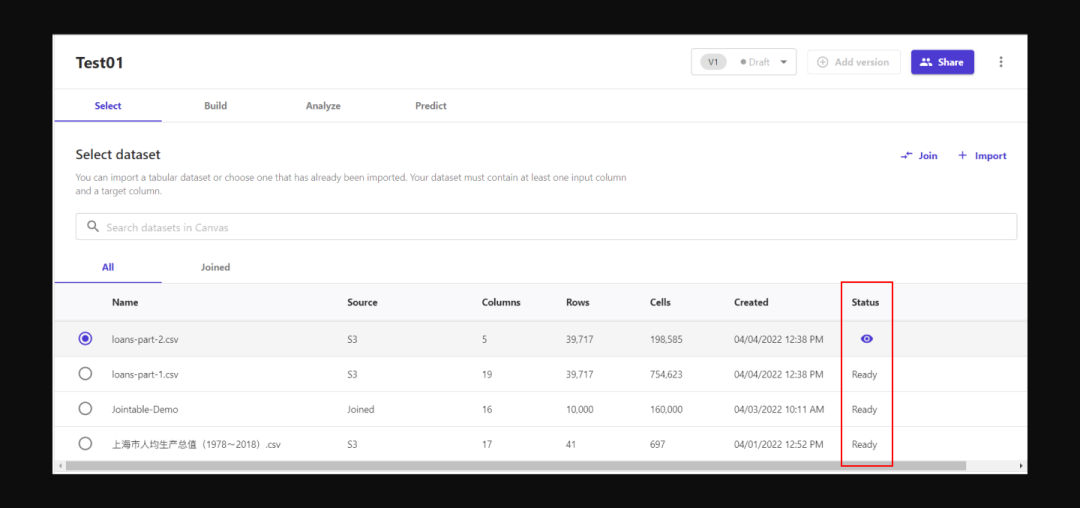
(2) Multi-Version Settings
Users find it difficult to obtain an ideal data model in one go and will search for the optimal solution through multiple versions. Canvas provides version management functionality. When users create a new version, the content from the previous version is automatically included; they only need to make adjustments to the indicator data and can switch quickly, making it more convenient than building a new model from scratch.
4. Visual Design, Enhancing Experience
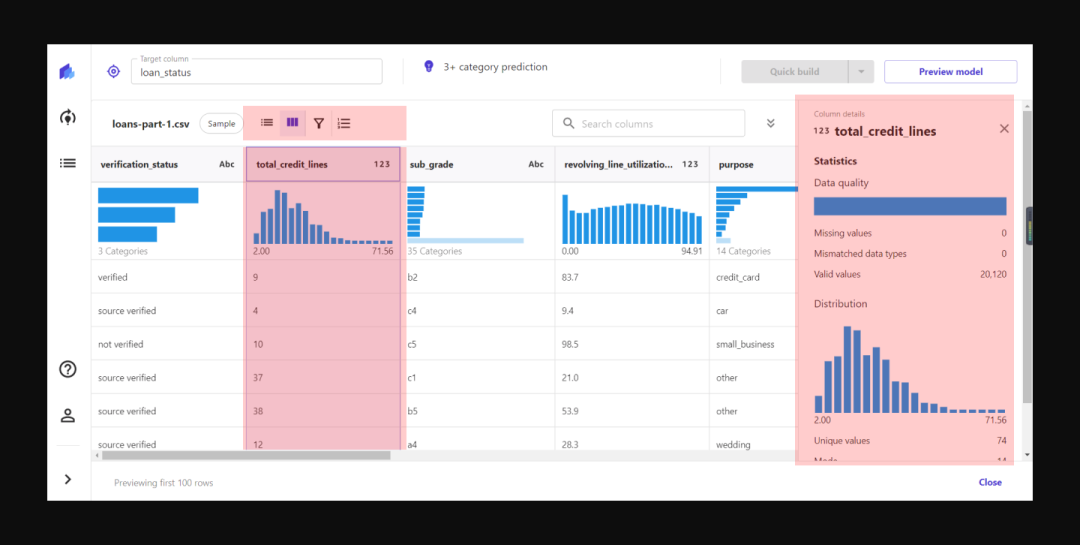
(1) Data Visualization
In machine learning modeling, data quality is key. Through Canvas, users can understand their data from multiple dimensions, truly preparing for data modeling.
Tabular data is often scattered and not intuitive enough. Therefore, graphical visualization is needed to help users better understand data quality, such as data distribution, etc. Canvas adds data visualization analysis in list mode. Clicking the header will also display more detailed data analysis information.
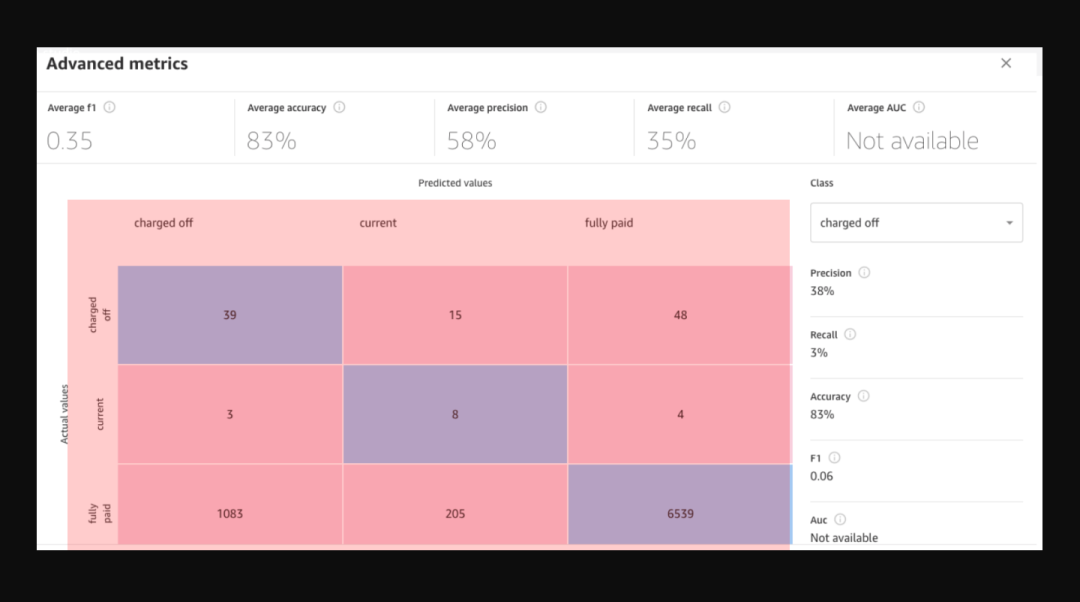
(2) Visualization of Results
Pure computation results do not hold much meaning for users; it is necessary to explain the key indicators that influence the computation results to help users make better action decisions. Canvas provides graphical display formats, which can better help users understand computation results and facilitate quick completion of analysis reports.
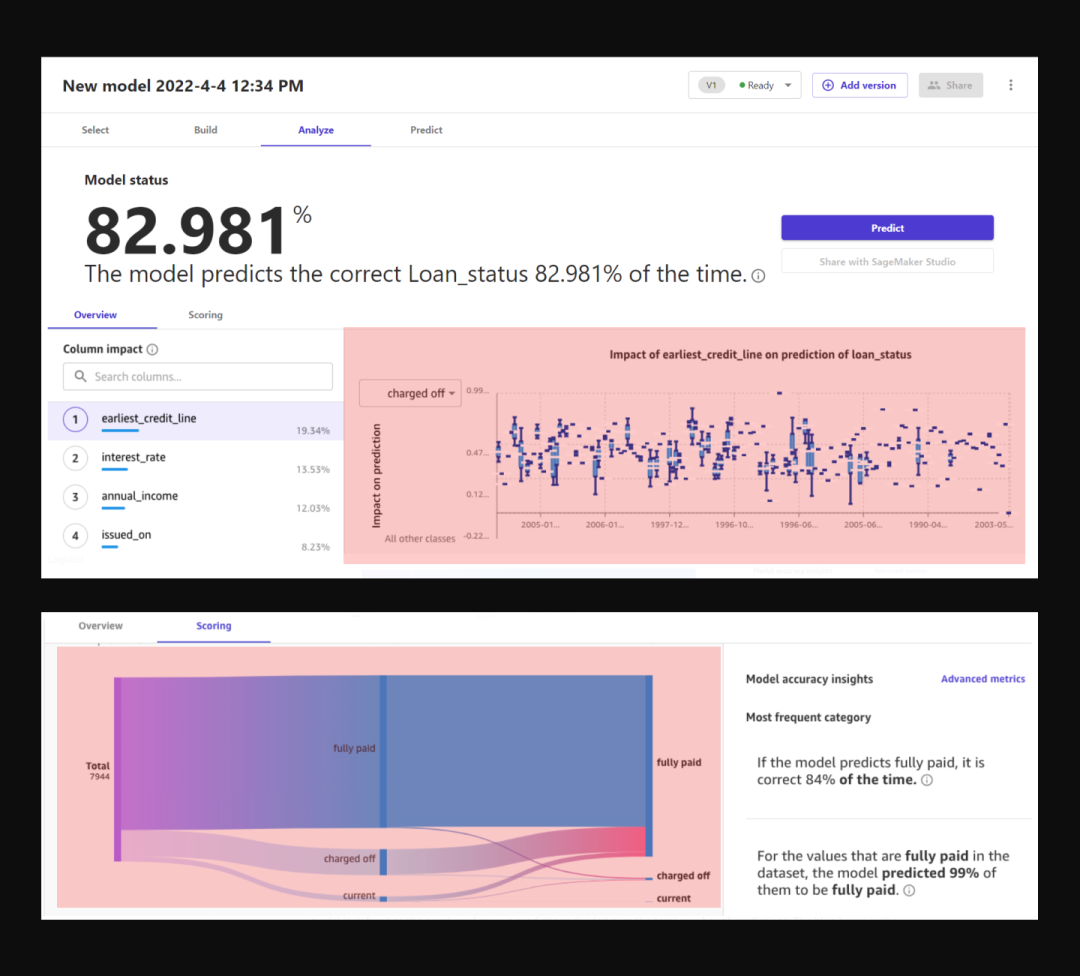
Additionally, advanced indicator analysis further demonstrates the logical relationships between indicators.
4. Visual Style Analysis
Visual style is subjective; everyone has different visual experiences. When you open Canvas, you will noticeably feel the difference from the overall design style of Amazon Cloud Technology products. Although integrated into the Amazon Cloud Technology platform, Canvas adopts a more consumer-oriented design style, with lighter styles and increased illustration elements, making it more approachable.
5. Scenario Expansion, Promoting Experience Upgrades
B-end products must not only solve user problems but also consider customer scenarios, user collaboration, and management. For example, users may simply need to quickly obtain predictive results for offline detection and validation, while others may wish to provide basic models to professional data scientists to obtain more accurate predictions.
Canvas provides two modeling construction methods: Quick Build and Standard Build.
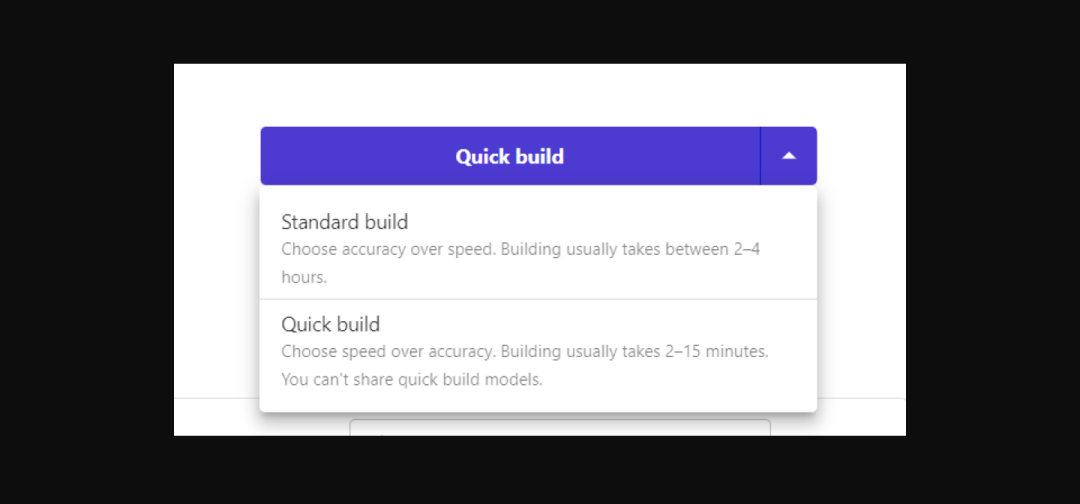
Quick Build is faster but may have some accuracy errors, requiring only 2-15 minutes to complete result predictions.
Standard Build has higher accuracy but takes longer, approximately 2-4 hours. Moreover, in standard mode, the generated model can be shared with data scientists or other colleagues for optimization and upgrading with one click.
6. Suggestions for Optimizing Canvas Experience
Canvas is not without flaws. During the experience process, I also discovered some detail issues, mainly including two major categories of problems. I hope for iterative optimization.
1. Information Feedback
(1) Page Prompts
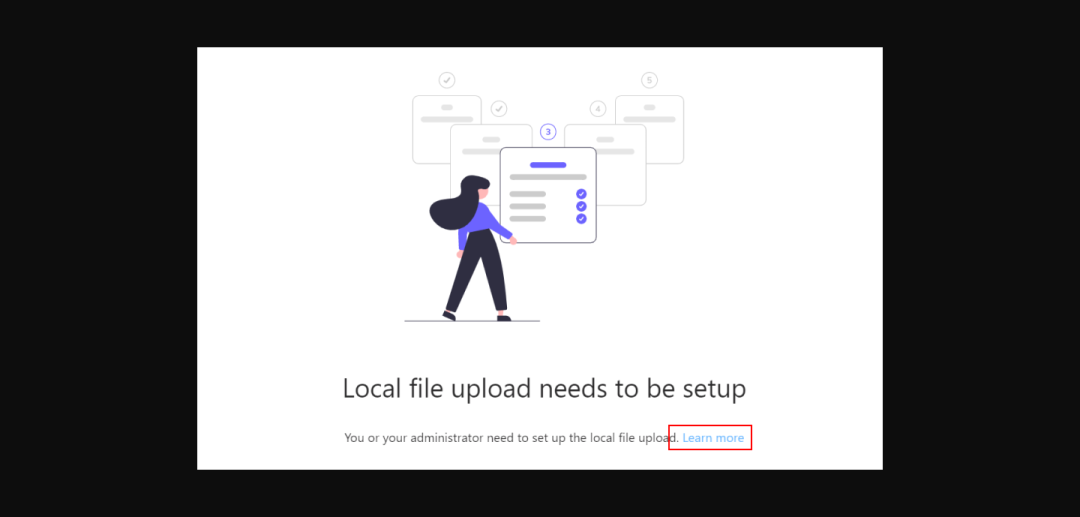
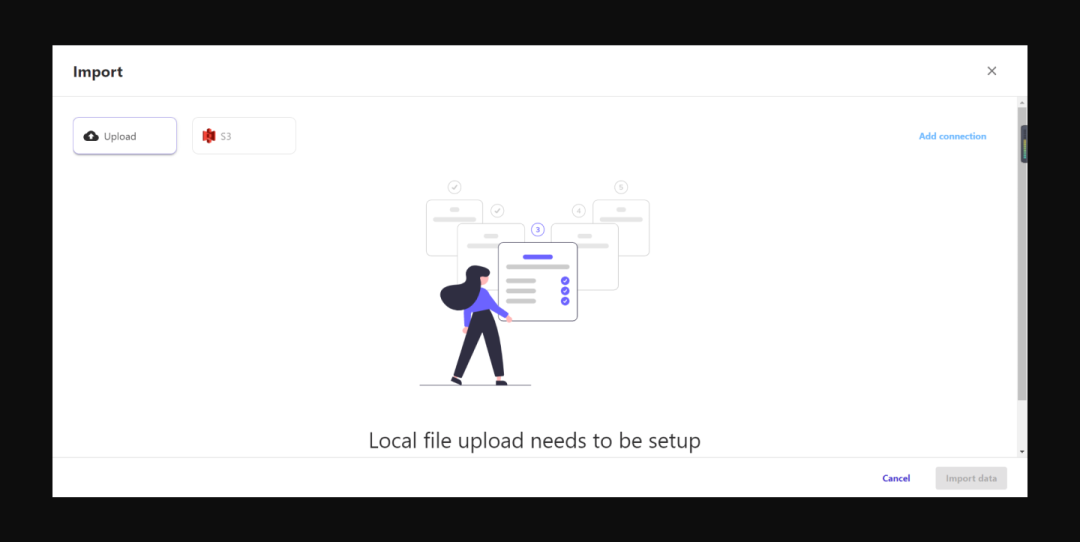
When users first upload data, they cannot directly upload content. The page only uses a text button to prompt users to “learn more.” When users see such a link, they easily think of a lengthy text in the help center, so their willingness to click is not strong.
I personally had to check other content multiple times and, out of desperation, finally chose to click the link. I found that the help center inserted a link to the S3 bucket, which then redirected me to the relevant page to complete the data upload, thus increasing the user’s operational cost.
Therefore, the page needs to provide concise prompts and functional buttons to offer users solutions, rather than simply linking to external content.
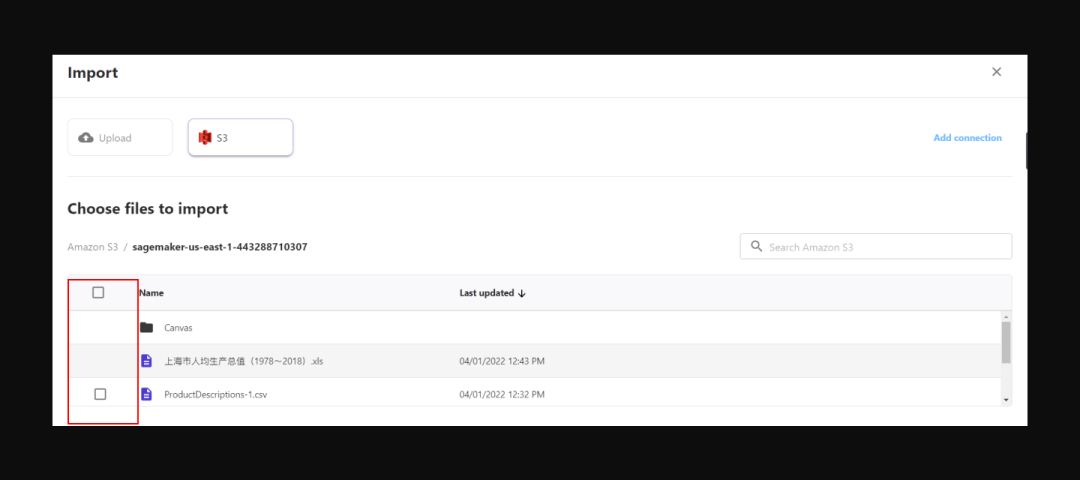
(2) Operational Prompts
After adding data to the S3 bucket, when importing into Canvas, users cannot select non-CSV format files, such as Excel files, but there is no corresponding prompt information on the page, requiring users to figure it out themselves.
(3) User Path
Canvas is essentially an independent functional space, isolated from Amazon Cloud Technology, and lacks a path or link to return to Amazon SageMaker and the console, leaving users unsure how to return.
2. Efficiency Improvement
(1) Operational Efficiency
In Canvas, imported alternative data cannot be deleted directly; users must go to “Data Management” to delete it. This is particularly unfriendly for users who make mistakes during import or for those with OCD, and it also increases users’ operational costs.
(2) Screen Display Efficiency
The efficiency of display on one screen, especially in an empty page state, is not sufficient. Users can only see the upload prompt information after scrolling.
(3) Page Jump Efficiency
In Amazon Cloud Technology products, all tasks are completed in the same browser window, and users cannot operate multiple windows in parallel. When users need to exit the current window during long model calculations in Canvas, they inevitably worry about whether the model calculation will stop, thus increasing the operational costs associated with page jumps.
Conclusion
Through the evaluation experience of Amazon SageMaker Canvas, we can summarize how data products can improve product experience:
-
Build user experience goals around user needs and scenarios;
-
Reduce mandatory processes, create parallel functions to achieve efficient user operations;
-
Visualize data tables, establish multi-dimensional data presentation to help users deepen their understanding;
-
Focus on expanding user scenarios, enhancing user experience through collaborative mechanisms.
That’s my personal experience~
|
Reply with the number 【01】 to obtain 100+ “Industry Reports” Reply with the number 【02】 to obtain “Large Factory Design Specifications” Reply with the number 【04】 to obtain “Portfolio Packaging Strategy” Reply with the number 【06】 to obtain “Written Test Interview Tips” Reply with the number 【08】 to obtain “Selected Mockup Collection” Additionally, you can also receive high-value materials such as “Large Factory Prototype Files”, “Designer Resume Samples”, “App Design Reference Works”, etc.  |