The knowledge graph is a crucial foundation supporting machines to achieve cognitive intelligence. In the process of digital transformation, with the continuous penetration of artificial intelligence and big data technologies, more and more enterprises require a robust underlying knowledge network to support them, building knowledge graphs and developing upper-layer applications to realize more intelligent business analysis and decision-making..
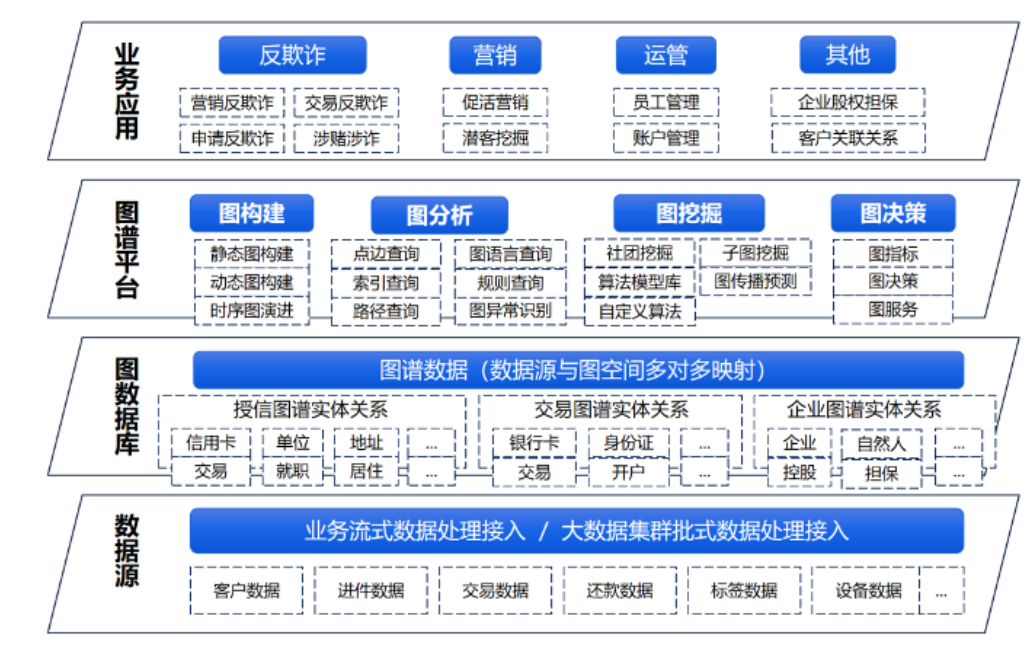
Bangsheng Technology’s knowledge graph provides a central-level graph platform, constructing an integrated platform that connects enterprise underlying data sources, graph data management, and graph platform applications. It achieves knowledge extraction, knowledge fusion, knowledge reasoning, knowledge storage, and knowledge application, assisting enterprises in quickly completing one-stop construction of knowledge graphs, creating rich business scenario applications, mining data value, and empowering digital transformation.
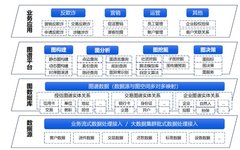
Among them, the underlying data layer can meet various data cleaning and access needs, supporting multiple data sources through streaming or batch access, and then mapping point-edge structures in the graph database, followed by completing graph construction, graph analysis, graph mining, and graph decision-making in the graph platform. It will also integrate visual operation components and various algorithms to adapt to the needs of different business lines at the top level, such as anti-fraud, marketing, operation management, potential customer mining, and enterprise guarantees.
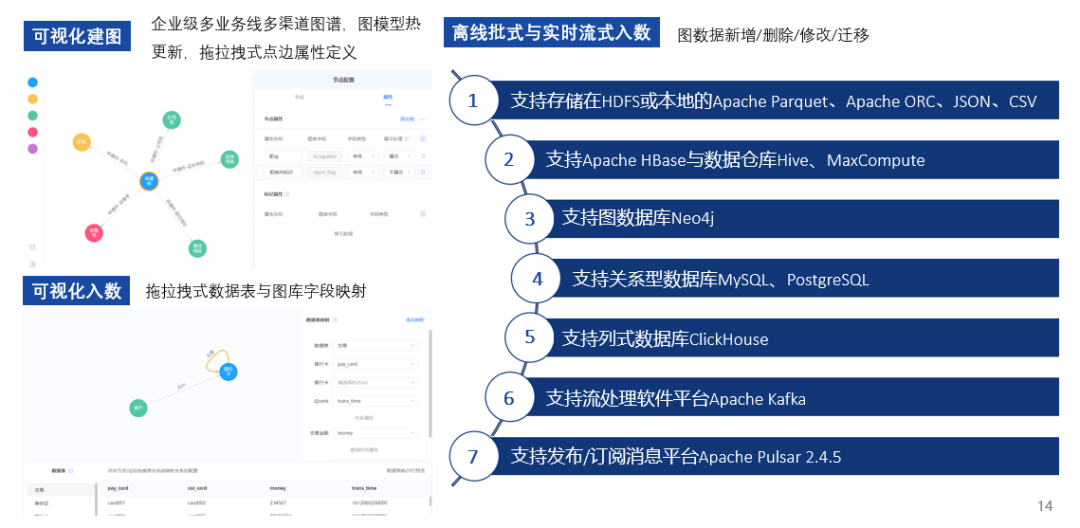
The graph platform has many core functions in applications, the first core function is graph construction. There are three ways to construct graphs, including visual graph construction, visual data input, offline batch and real-time streaming input. Whether constructing graphs or inputting data, it involves data sharing. Bangsheng Technology’s knowledge graph platform, as a central-level, integrated platform, has achieved permission isolation and data sharing based on the needs of multiple business lines.
Various input methods are supported, including batch and streaming, as well as data sources, such as conventional relational database inputs, middleware Kafka inputs, etc.
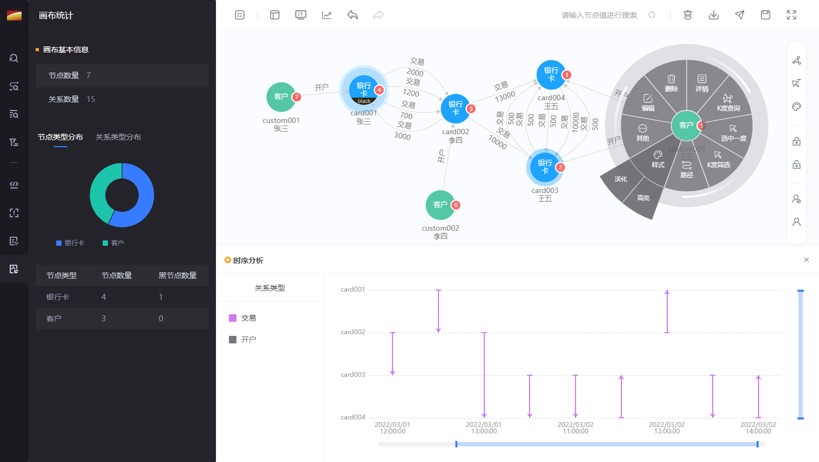
The second application is graph analysis, including interactive analysis, intelligent analysis, and performance optimization. Bangsheng Technology’s knowledge graph platform integrates many visual analysis tools to provide easy-to-use interactions, such as time series analysis. Time series analysis can observe the correlation of account entry and exit times on small, high-frequency issues, and aggregation can combine business experience to display point-edge relationships.
In addition, the platform has instant algorithms, as well as path analysis, loop detection, anomaly identification, etc. Based on the analysis, Bangsheng Technology also makes many data optimizations based on actual business experience, especially for the simplification of evolving structures, because the ultimate goal of the knowledge graph is to serve decision-making and business.
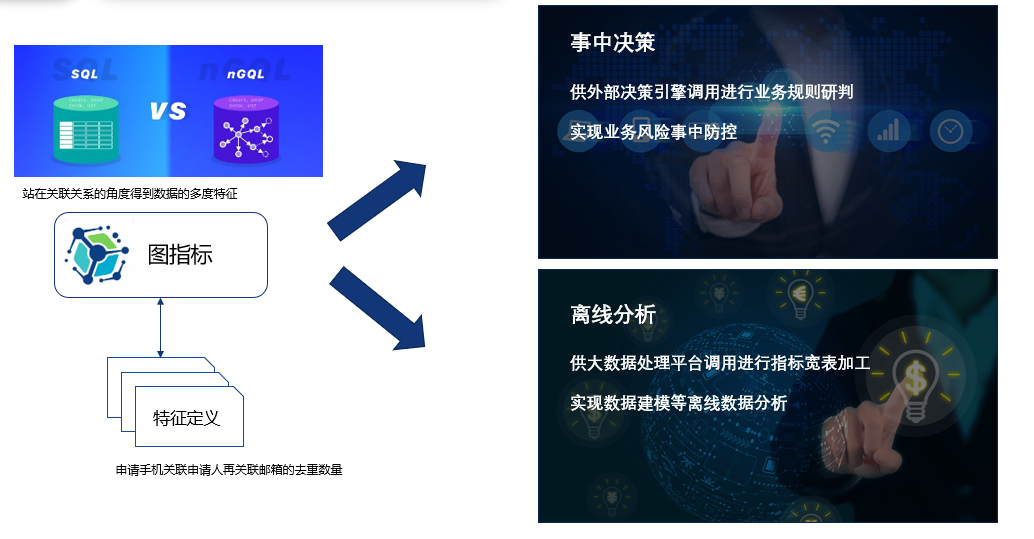
Graph metrics are some graph grid features directly extracted after graph analysis and form a type of computational metric. This computational metric will be linked with expert rule metrics to fine-tune upper-level decision-making.
A simple use of graph metrics is to trigger blacklists using similar correlation relationships, but more often we will integrate graph metrics with expert rule statistical metrics and model features for fusion decision-making. It should be noted that fusion decision-making does not refer to isolated decision-making, but rather to fusion at the compilation level, meaning that fusion decision-making is done together at the graph metric stage.
Graph metrics mainly have two applications, the first is decision-making in the process, and the second is post-event analysis, which are real-time and post-event, these are currently two typical uses of graph metrics.
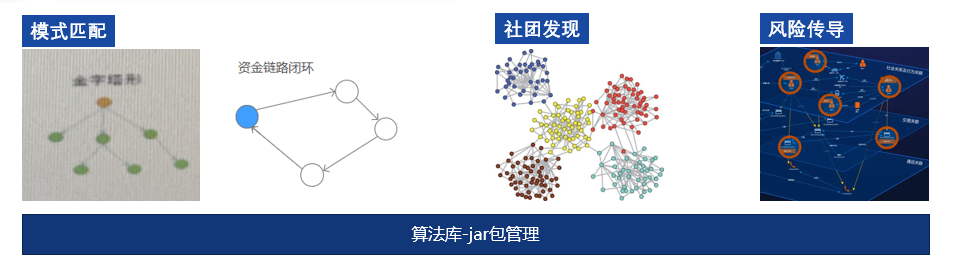
Compared to graph metrics, graph algorithms delve deeper into association actions. For example, pattern matching involves filtering risk patterns of closed funding chains after business definitions, which is a one-to-many-to-one pattern. Money laundering can also exhibit many closed-loop risk patterns, which can be executed in the graph database after being defined.
The second type is community discovery, using algorithms for community segmentation, forming a group for business verification and analysis, automatically discovering clustered communities from associated graphs through machine learning methods. Community discovery can be semi-supervised, using a small amount of labeled data as seeds, or unsupervised. Finally, there are algorithms for risk transmission within the guarantee circle. All these are abstracted based on feature patterns and ultimately integrated into system functions.