Research and Development Ideas
Here is a preparation by Xiaosen


Document
Contribution
File
Case
Title: Comprehensive Analysis of Genes Related to Oxidative Stress and Cellular Senescence in Triple-Negative Breast Cancer
Published Journal: Heliyon
Publication Date: 2024-07-16
Impact Factor: 3.4

[Background]
Oxidative stress and cellular senescence (OSCS) significantly impact the occurrence and progression of triple-negative breast cancer (TNBC). This study aims to establish a prognostic model for TNBC based on differentially expressed genes (OSCSRDEGs) associated with oxidative stress and cellular senescence.

[Methods]
Using the TCGA and GEO databases to identify OSCSRDEGs. Single-sample gene set enrichment analysis was used to examine the relationship between OSCSRDEGs and immune infiltration. A prognostic model was constructed using least absolute shrinkage and selection operator (LASSO) regression analysis, Cox regression, and Kaplan-Meier analysis. The prognostic efficacy was evaluated using receiver operating characteristic (ROC) curves, nomograms, and decision curve analysis (DCA). Gene set enrichment analysis (GSEA), gene ontology (GO), and Kyoto encyclopedia of genes and genomes (KEGG) were used to explore potential functions and mechanisms.

[Results]
1. Dataset Processing
The TNBC-related datasets (TCGA-TNBC, GSE57544, GSE24202) were initially standardized using the “normalizeBetweenArrays” function from the R package limma. The expression levels of these three datasets (TCGA-TNBC (Figure 1A-B), GSE57544 (Figure 1C-D), and GSE24202 (Figure 1E-F)) showed consistent trends after normalization.
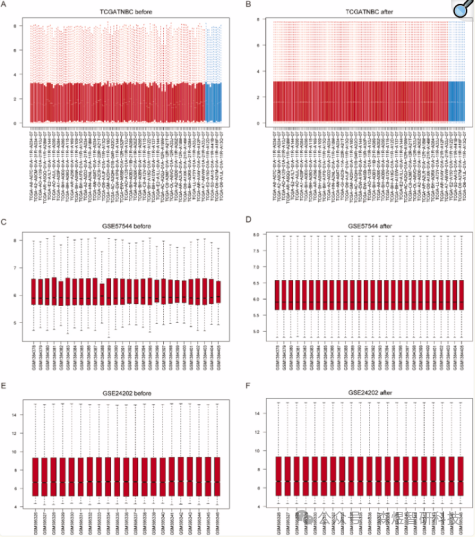
Figure 1: Boxplots of TCGA-TNBC, GSE57544, and GSE24202 datasets before and after normalization
2. GSEA Analysis of Cancer Group and Control Group (TNBC/Control)
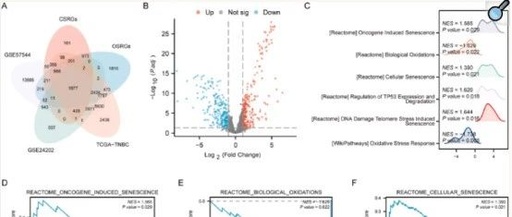
Based on the intersection of oxidative stress and cellular senescence-related genes, three datasets (TCGA-TNBC, GSE57544, and GSE24202) with expression data were retained. To assess the impact of gene expression levels on TNBC in the TCGA-TNBC dataset, GSEA techniques were employed, which help study the correlation between gene expression and various biological processes, cellular components, and molecular functions associated with 1879 genes. The results indicated that these genes are enriched in pathways related to oncogene-induced senescence, bio-oxidation, cellular senescence, regulation of TP53 expression and degradation, DNA damage-induced senescence, oxidative stress response, and other pathways described in 2D-I.
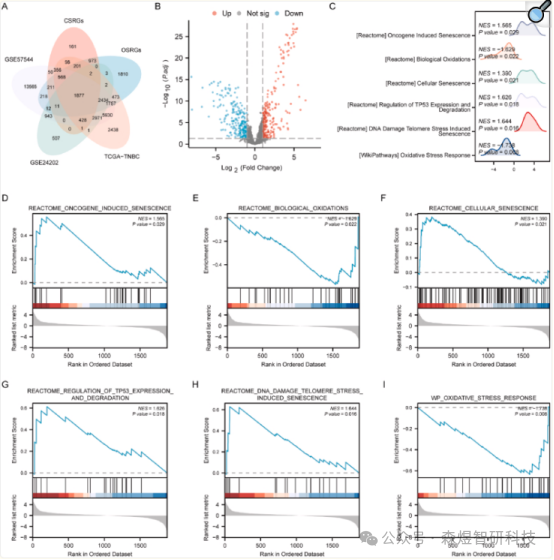
Figure 2: (A) Venn diagram of OSCSRG (B) Volcano plot of OSCSRGs (C-I) GSEA enrichment of six main biological features
3. Mutation Analysis of OSCSRDEGs in TNBC Tissues
A total of 469 OSCSRDEGs were further screened using univariate COX analysis. Only genes with p < 0.05 were retained, resulting in the identification of 27 OSCSRDEGs. The results indicated that the TCGA-TNBC dataset exhibited four main somatic mutation types: missense mutations, nonsense mutations, frameshift deletions, and frameshift insertions. Among these, missense mutations were found to be the most common. Furthermore, Figure 3B comprehensively displays all somatic mutations (SNPs) of the 27 OSCSRDEGs in TNBC patient samples. The findings revealed a significant number of amplifications and deletions in the samples of TNBC patients with the 27 OSCSRDEGs, with CFH, IVL, and KLF10 identified as the most amplified OSCSRDEGs.
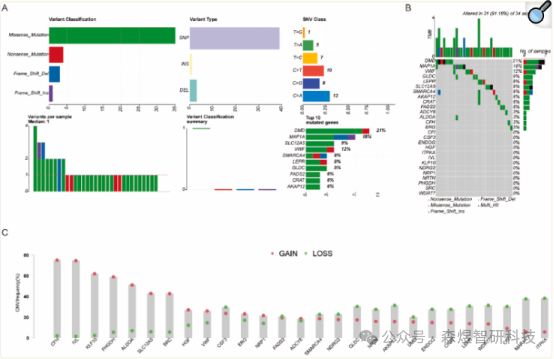
Figure 3: (A) Somatic mutations of OSCSRDEGs in TNBC (SNPs) (B) Proportion of somatic mutations of OSCSRDEGs in TNBC (C) CNV of OSCSRDEGs in TNBC
4. Construction of OSCSscore and Its Impact on Immune Assessment in TCGA-TNBC
The results indicated significant statistical differences in the ESTIMATE scores (4A) and stromal scores (4C) observed between different sample groups (low/high OSCSscore) in the TCGA-TNBC dataset (P < 0.05). There was a significant positive correlation between StromalScore, ESTIMATE scores, and OSCSscore. However, no significant correlation was observed between immune scores and OSCSscore.
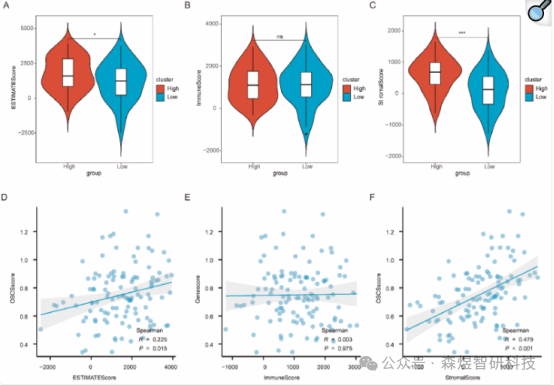
Figure 4: (A-C) Violin plots of ESTIMATE scores, immune scores, and Stromal scores between high and low groups; (D-E) Scatter plots of correlations between ESTIMATE scores, immune scores, stromal scores, and OSCS scores
According to the results of the difference analysis of immune characteristics between high and low groups in the TCGA-TNBC dataset, significant statistical differences were observed in the infiltration levels of five immune cell types between the low/high OSCSscore groups (p < 0.05). The findings indicated that the majority of the infiltration abundance of the five immune cell types in the low OSCSscore group (Figure 5B) and high OSCSscore group (Figure 5C) samples were positively correlated. In the low group of the TCGA-TNBC dataset (Figure 5D), significant associations were observed between five different cell types and 19 specific genes, with positive correlations being dominant.
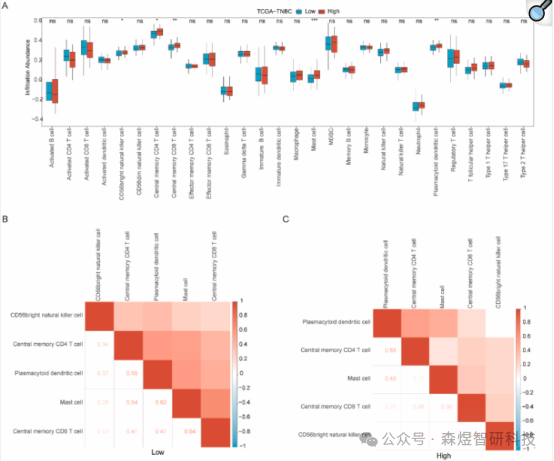
Figure 5: (A) Comparative analysis of ssGSEA immune infiltration results for low/high OSCS score groups (B-C) Correlation analysis results of immune cell infiltration abundance (D-E) Scatter plots of correlations between immune cells and 27 OSCSRDEGs
According to the results of the difference analysis of CIBERSORT immune characteristics between high and low groups in the TCGA-TNBC dataset, TNBC samples were divided into low/high OSCSscore groups based on the median of OSCSscore. The CIBERSORT algorithm was used to calculate the infiltration abundance of 22 immune cells in the low/high OSCSscore groups. A stacked bar chart visually represented the proportion of immune cells in the dataset sample infiltration levels (Figure 6A). The results indicated that among the 21 immune cells present in the TCGA-TNBC dataset, their infiltration abundance was not always zero in TNBC samples. In the TCGA-TNBC dataset, significant positive correlations were observed between the infiltration abundance of three immune cells in the low OSCSscore group (Figure 6C) and high OSCSscore group (Figure 6D) and the expression levels of 27 key genes.
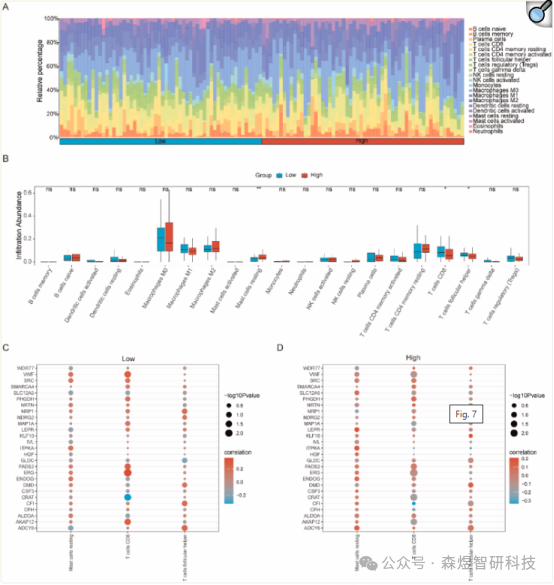
Figure 6: (A-B) CIBERSORT immune infiltration analysis results displayed as stacked bar charts and group comparison plots (C-D) Scatter plots of correlations between immune cells and OSCSRDEG
5. Construction of the Prognostic Model for OSCSRDEGs
To assess the prognostic value of the 27 OSCSRDEGs, the expression levels of these 27 OSCSRDEGs in the TCGA-TNBC dataset were combined with prognostic information for LASSO regression analysis to establish a prognostic model (Figure 7A). Throughout the process, we identified and retained 15 of the 27 OSCSRDEGs as potential biomarkers for TNBC. Furthermore, the results of the LASSO regression were visually represented by the LASSO variable trajectory plot (Figure 7B). To further validate the prognostic significance of the 15 OSCSRDEGs in the TCGA-TNBC dataset, the sample grouping in the developed OSCSRDEGs prognostic model was visually represented by risk factor plots (Figure 7C). The dataset samples were classified based on the median of the RiskScore predicted by the OSCSRDEGs prognostic model, leading to risk grouping. Additionally, a dot plot visually described the survival time and survival outcomes of clinical samples in the TCGA-TNBC dataset.
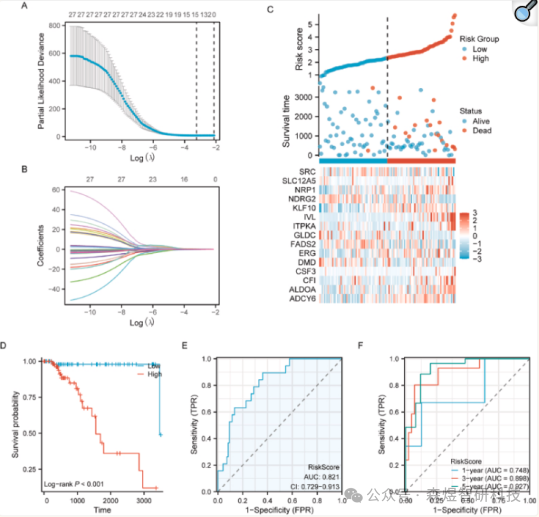
Figure 7: (A) Prognostic model diagram of OSCSRDEGs (B) Variable trajectory plot (C) Risk factor plot (D-F) KM curves, ROC curves, and time-dependent ROC of the OSCSRDEGs prognostic model RiskScore in the TCGA-TNBC dataset
6. GSVA Analysis Between High-Risk and Low-Risk Groups of the Prognostic Model
Using GSVA to compare gene expression between high-risk and low-risk groups in the TCGA-TNBC dataset (divided by median). The top 10 pathways with the highest logFC and the bottom 10 pathways with the lowest logFC that met the p-value criteria were selected. The R package pheatmap was used to generate heatmaps to visualize the specific results of the differential analysis (Figure 8A). Additionally, the Mann-Whitney U test was used to assess the degree of differences in these 20 pathways between different groups in the TCGA-TNBC dataset, and the results were described in comparison plots (Figure 8B). The research results indicated significant statistical differences in the expression of these 20 pathways between groups within the TCGA-TNBC dataset (P < 0.01).
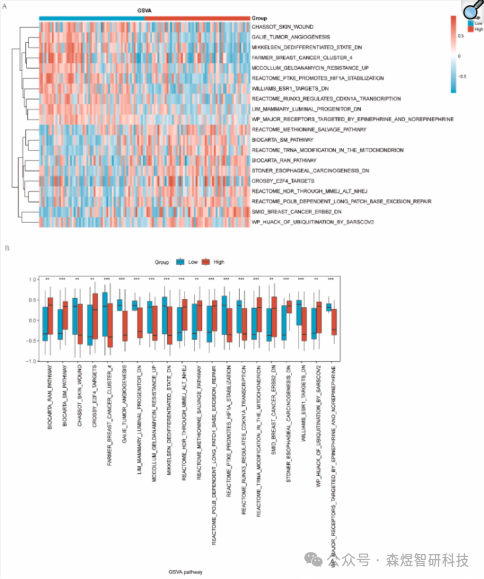
Figure 8: Complex numerical heatmap and group comparison plot of GSVA enrichment analysis results between high and low-risk groups in the TCGA-TNBC dataset
To investigate the biological processes and molecular functions of the 15 OSCSRDEGs in the TCGA-TNBC dataset, GO and KEGG enrichment analyses were performed. Enrichment items were screened according to the criteria of p < 0.05 and q < 0.25, and pathways meeting these criteria were considered statistically significant. The results indicated that the collective count of the 15 OSCSRDEGs showed significant enrichment in different BPs. Additionally, a subset of the 15 differentially expressed genes was mainly enriched in KEGG pathways related to GABAergic synapses.
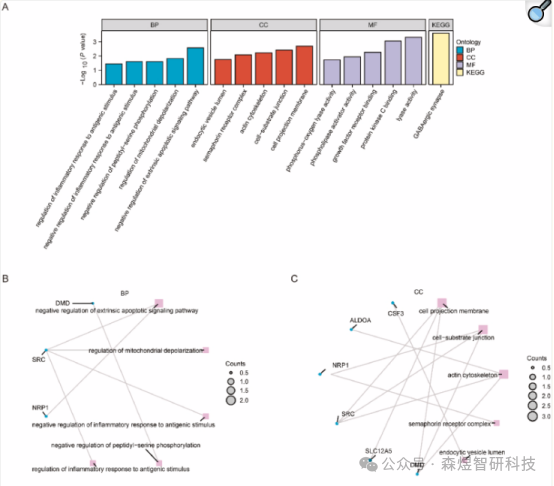
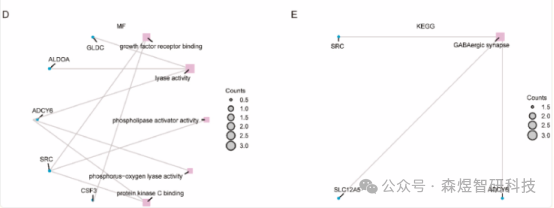
Figure 9: (A) Bar chart of GO and KEGG enrichment analysis results (B-E) Circular network diagrams of BP pathways, CC pathways, and MF pathways in GO functional enrichment analysis and KEGG enrichment results
7. Differential Expression Analysis of OSCSRDEGs
Wilcoxon rank-sum tests were employed to examine the expression differences of the 15 OSCSRDEGs between the low Lasso risk score group and the high Lasso risk score group in the TCGA-TNBC dataset and GSE57544 dataset. The results indicated that 11 types showed significant differences between the high-risk and low-risk groups in the TCGA-TNBC dataset (Figure 10A). Similarly, in the GSE57544 dataset, 5 OSCSRDEGs exhibited significant differences (Figure 10B). Four OSCSRDEGs showed statistically significant differences in both the TCGA-TNBC and GSE57544 datasets. The findings revealed that CFI and NRP1 were upregulated in the high-risk group samples of both datasets, while DMD and NDRG2 were downregulated in the high-risk group samples compared to the low-risk group samples in both datasets.
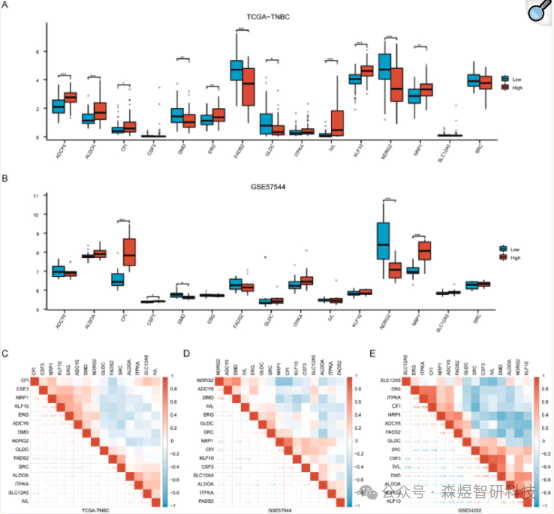
Figure 10: (A-B) Group comparisons of the expression of 15 OSCSRDEGs in the TCGA-TNBC dataset and GSE57544 dataset (C-E) Heatmaps of correlation of expression levels of 15 OSCSRDEGs in the TCGA-TNBC dataset, GSE57544 dataset, and GSE24202 dataset
8. Construction of Multivariable Cox Prognostic Model in the TCGA-TNBC Dataset
The four OSCSRDEGs that exhibited significant differences in risk scores between groups in the TCGA-TNBC and GSE57544 datasets were included in multivariable Cox regression analysis to construct a prognostic model. DCA was used to evaluate and demonstrate the clinical efficacy of the developed multivariable Cox regression model within 1 year (Figure 11C), 3 years (Figure 11D), and 5 years (Figure 11E). The X-axis of the DCA plot corresponds to probability thresholds or threshold probabilities, while the Y-axis represents net benefits. The results can be assessed by examining the stability of the area above the full positive line and below the full negative line, as well as the sections between the full positive line and full negative line. A larger area indicates better model performance. The findings indicated that the clinical predictive effect of our developed multivariable Cox regression model was ranked as follows: 3 years > 5 years > 1 year.
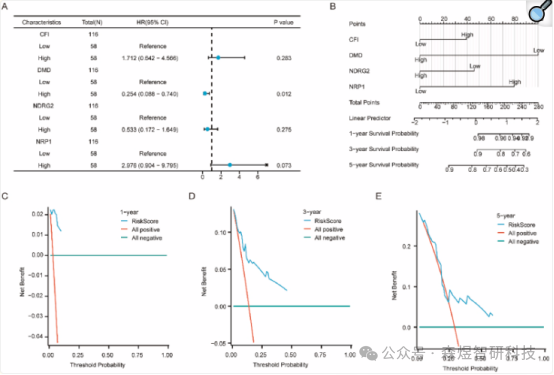
Figure 11: (A) Forest plot of the multivariable Cox regression model (B) Nomogram of the multivariable Cox regression model (C-E) DCA plots of 1-year, 3-year, and 5-year outcomes from the multivariable Cox regression model

[Conclusion]
This study conducted a comprehensive analysis of OSCSRDEGs in TNBC, successfully identifying four key OSCSRDEGs (CFI, DMD, NDRG2, and NRP1) and developing an accurate OSCS-related prognostic model for TNBC patients. Furthermore, the potential mechanisms of OSCSRDEGs in TNBC were elucidated, and their expression was assessed in relation to tumor microenvironment infiltration characteristics. These findings are expected to provide therapeutic targets and valuable guidance for monitoring the effectiveness of personalized clinical treatments.
Thoughts
Path
Evolution
Life
Triple-negative breast cancer (TNBC) is a subtype of breast cancer with poor prognosis, characterized by a lack of ER, PR, and HER-2 expression. In recent years, although there has been some progress in the treatment of TNBC, its recurrence and mortality rates remain high. Therefore, exploring the molecular mechanisms of TNBC development, identifying new therapeutic targets and prognostic markers are still hot topics in current research.
Oxidative stress (OS) and cellular senescence (CS) play important roles in tumor development. However, their specific roles in TNBC and their relationship with the immune microenvironment remain unclear. In preliminary studies, a series of OSCS-related genes (OSCSRGs) were identified through bioinformatics analysis, among which CFI, DMD, NDRG2, and NRP1 were found to be key prognostic-related genes. Additionally, we found that OSCSRGs are closely related to tumor immune infiltration, suggesting that OSCS may influence the prognosis of TNBC by affecting the immune microenvironment.
Editor: Xiyu
Contributed by: Shengyue
Reviewed by: Li Ping
「Original」 only represents original compilation, onlyfor sharing foracademic exchange, literature interpretation or any omissions, we sincerely apologizefor any infringement, please contact the author team in a timely manner, we will modify and reissue or withdraw the article as soon as possible, thank you for your understanding!
Previous Recommendations
1
Is the online pharmacy too monotonous? Add transcriptomics and molecular docking to replicate ideas!
2
Good ideas for bioinformatics beginners: Transcriptomics + drug target screening, simple and reproducible
3
Network pharmacology + molecular docking, a powerful combination, aiming for Nature sub-journals with high scores!
4
Everything can be Mendelian! A multidisciplinary and multi-level study from Gannan Medical University: MR + network toxicology + single-cell + molecular docking, everyone loves it!
Click
Blue text to follow us