Machine Heart Column
Author: Liu Zhongyu
Source: Geetest (geetest_jy)
Today I want to share with you about Graph Convolutional Networks. With the development of artificial intelligence, many people have heard of concepts such as machine learning, deep learning, and convolutional neural networks. However, Graph Convolutional Networks are not often mentioned. So, what are Graph Convolutional Networks? Simply put, they study graph data and employ convolutional neural networks as their models.
Why Graph Convolutional Networks?
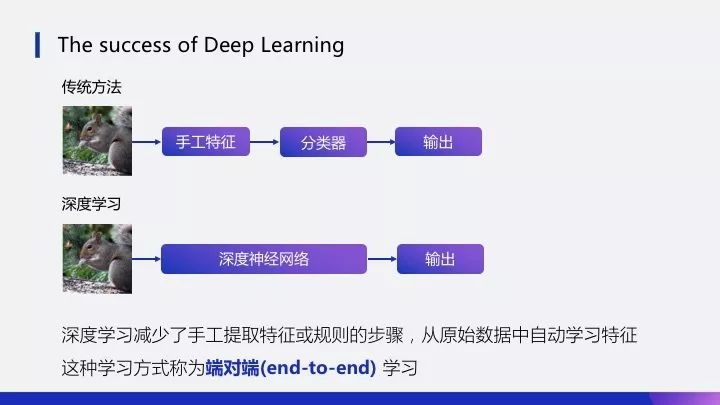
Since 2012, deep learning has achieved great success in the fields of computer vision and natural language processing. What makes it better than traditional methods?
Suppose there is an image that needs to be classified. Traditional methods require manual extraction of features such as texture, color, or some higher-level features. These features are then input into classifiers like random forests to provide an output label indicating the category. In contrast, deep learning inputs an image directly into a neural network, which outputs a label. This process combines feature extraction and classification into one step, avoiding the need for manual feature extraction or rules, and automating the extraction of features from raw data in an end-to-end manner. Compared to traditional methods, deep learning can learn more efficient features and patterns.
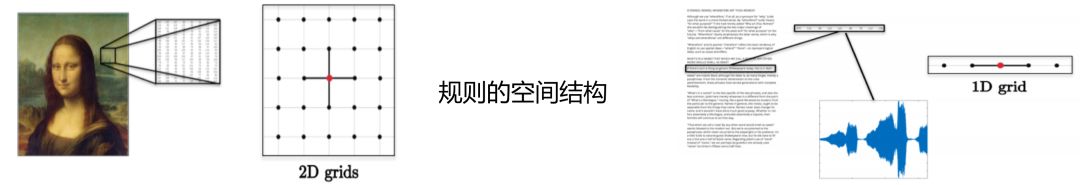
Convolutional neural networks are great, but they are still limited to data in Euclidean domains. What is Euclidean data? The most significant feature of Euclidean data is its regular spatial structure, such as images represented as regular square grids or audio represented as regular one-dimensional sequences. These data structures can be efficiently processed by convolutional neural networks.
However, in our real lives, there are many data types that do not possess regular spatial structures, known as Non-Euclidean data. Examples include recommendation systems, electronic transactions, computational geometry, brain signals, and molecular structures that can be abstracted into graphs. In these graph structures, each node connects differently; some nodes have three connections, while others have two, indicating irregular data structures.
Below, I will illustrate what a graph is using two typical business scenarios:
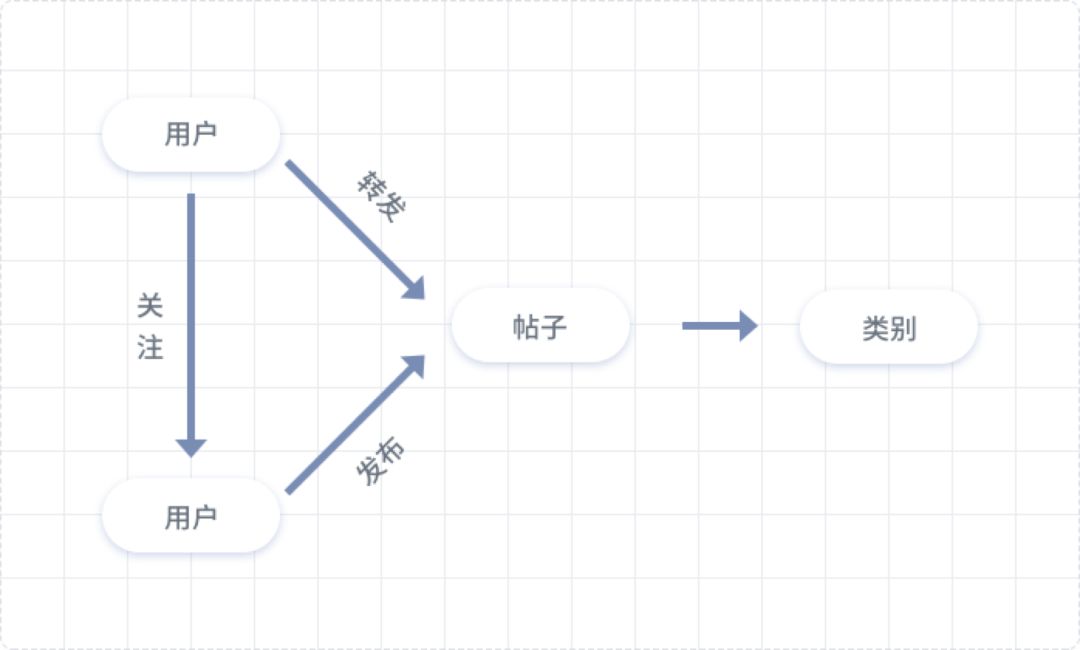
Social networks are very suitable for expression using graph data.
The graph above depicts the various nodes in a social network and their relationships. Users A and B, along with posts, are nodes, while the relationship between users is one of following, and the relationship between users and posts may be publishing or sharing. Through this graph, we can analyze what users are interested in and further implement a recommendation mechanism.
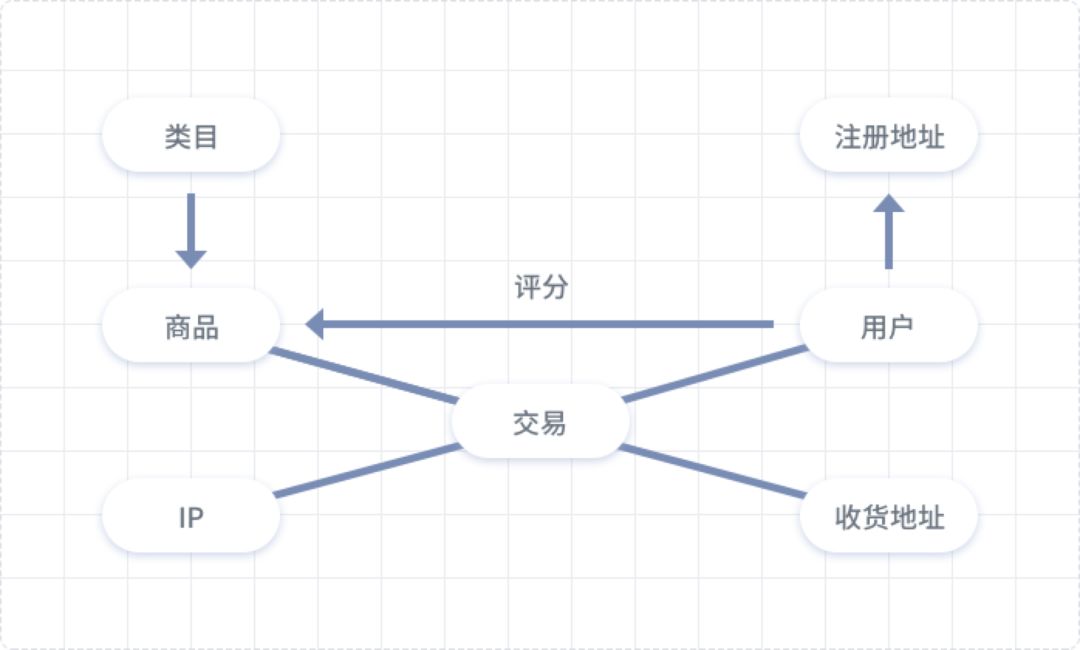
Graph in the e-commerce scenario.
In e-commerce, the key nodes we can first think of are users, transactions, and products. Nodes associated with users may include registration addresses and delivery addresses; transactions may relate to products, delivery addresses, transaction IPs, etc.; products may relate to categories. The relationships between these nodes allow users to not only purchase products through transactions but also rate them. This type of graph data can be used for two purposes: recommendations and fraud detection.
From the two examples above, we can clearly feel that graphs have two fundamental characteristics:
First, each node has its own feature information. For the graph above, we establish a risk control rule to check if a user’s registration address, IP address, and delivery address are the same. If these feature information do not match, the system will determine that this user poses a certain fraud risk. This is an application of feature information of graph nodes.
Second, each node in the graph also has structural information. If a certain IP node connects to many transaction nodes over a period of time, meaning that many edges extend from that IP node, the risk control system will determine that this IP address is at risk. This is an application of structural information of graph nodes.
In summary, in graph data, we must consider both the feature information of nodes and their structural information. If we rely on manual rules to extract features, we will inevitably lose many hidden and complex patterns. So, is there a method that can automate the simultaneous learning of both feature and structural information of graphs? — Graph Convolutional Networks
What are Graph Convolutional Networks?
Graph Convolutional Networks (GCN) are a method for deep learning on graph data.
Graph Convolution Operator:
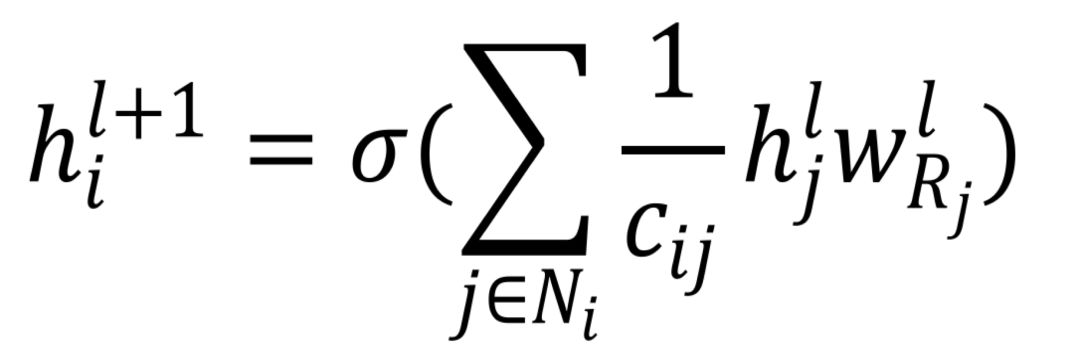
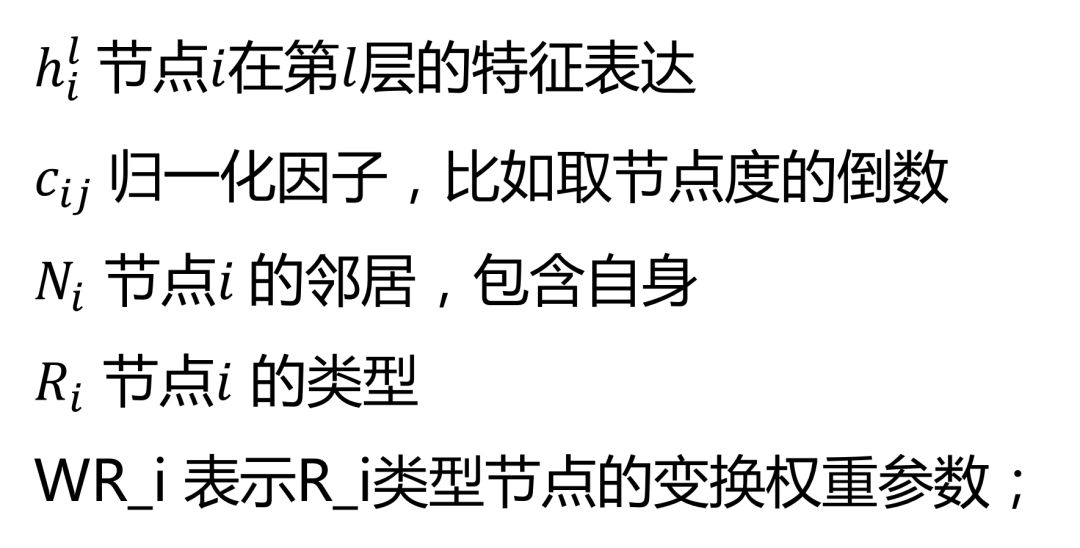
The formula for the graph convolution operator is given above, with the center node denoted as i;
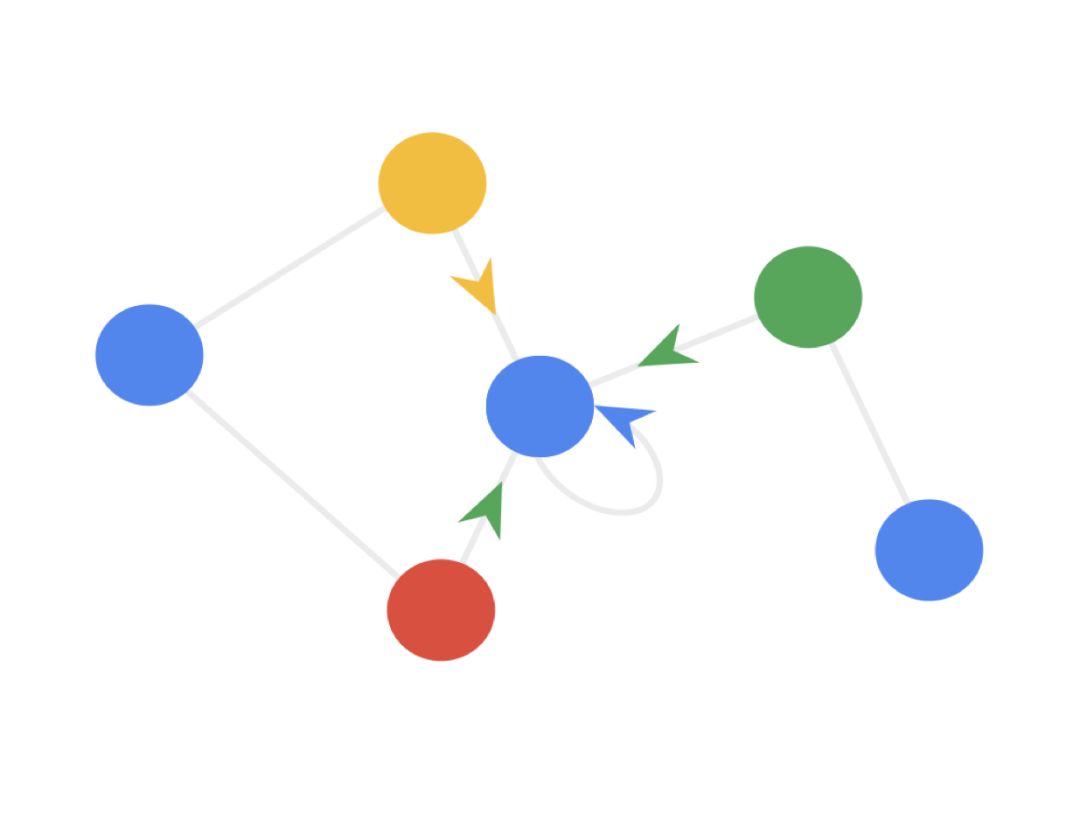
How to understand the graph convolution algorithm? We can see the animation in three steps (note that different colors represent different weights):
Step 1: Send each node sends its own feature information to neighboring nodes after transformation. This step extracts and transforms the feature information of the nodes.

Step 2: Receive each node gathers the feature information from neighboring nodes. This step integrates the local structural information of the nodes.

Step 3: Transform the gathered information through a nonlinear transformation to enhance the model’s expressive power.

Graph Convolutional Networks possess the following properties of convolutional neural networks:
-
Local parameter sharing, the operator is applicable to each node (the circles represent operators) and is shared everywhere.
-
The receptive field is proportional to the number of layers; initially, each node contains information from its direct neighbors, and when calculating the second layer, it can include information from the neighbors’ neighbors, thus involving more and more information in the computation. The more layers, the broader the receptive field, and the more information involved in the computation.
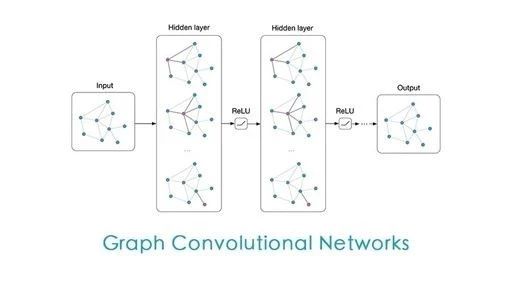
Let’s look at the GCN model framework. The input is a graph, which undergoes layer-by-layer transformations, resulting in an output graph.
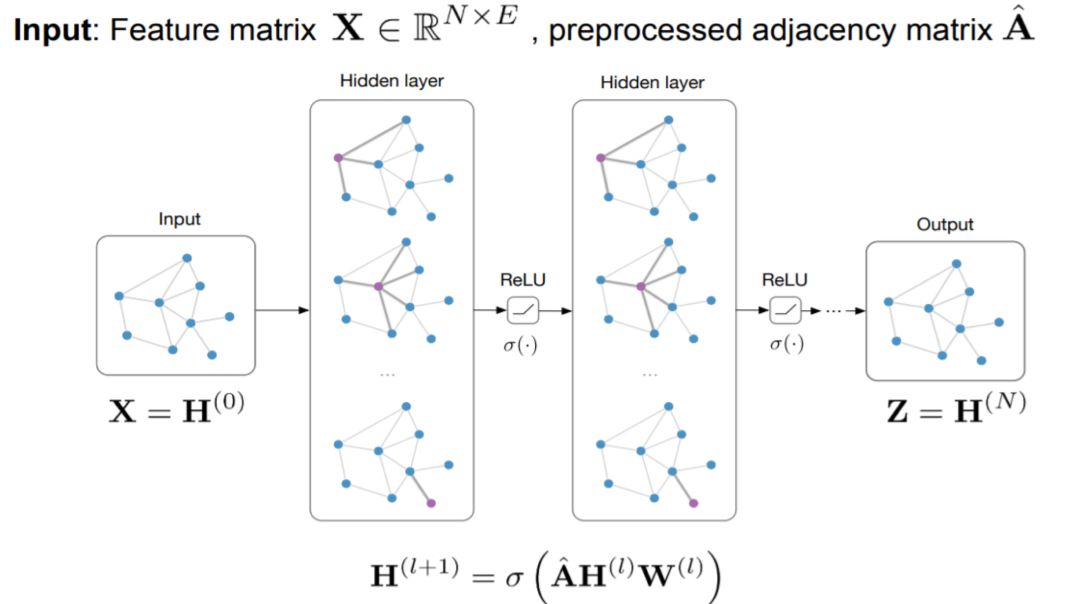
The GCN model also possesses the three properties of deep learning:
-
Hierarchical structure (features are extracted layer by layer, becoming more abstract and advanced);
-
Nonlinear transformation (enhancing the model’s expressive power);
-
End-to-end training (no need to define any rules; just label the nodes of the graph and let the model learn by itself, integrating feature and structural information).
Four features of GCN:
-
GCN is a natural extension of convolutional neural networks in the graph domain.
-
It can simultaneously learn node feature information and structural information in an end-to-end manner, making it the best choice for graph data learning tasks.
-
Graph convolution is highly adaptable, suitable for nodes and graphs of any topological structure.
-
In tasks such as node classification and edge prediction, it significantly outperforms other methods on public datasets.
How do we use Graph Convolutional Networks?
Below, I will share an experiment from our practical application scenario:
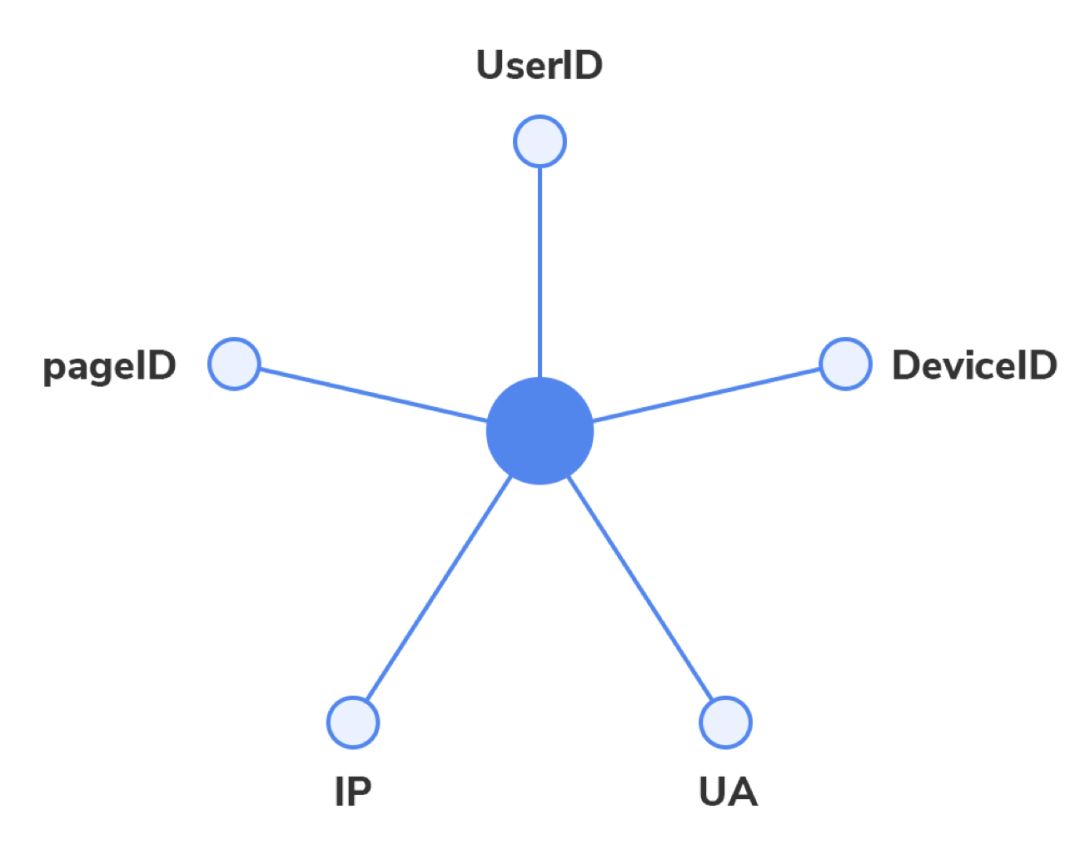
The input for the experiment is a graph data composed of validation events and attributes such as IP, DeviceID, and UA nodes. (We used 30 days of validation data, with data from every two hours forming a graph, totaling 360 graphs.)
The output of the experiment is to classify event nodes as normal or abnormal.
Experiment Details
Network Structure:
GCN(128)->GCN(64)->GCN(64)->Linear(2)
Training: Adam optimizer, lr=0.001
Reference Benchmark: GBDT, which can only learn feature information, is used as a benchmark, grid_search for hyperparameter tuning; GBDT is currently the most popular shallow classifier.
We trained on the data from the first day, and the prediction results over 30 days are as follows:
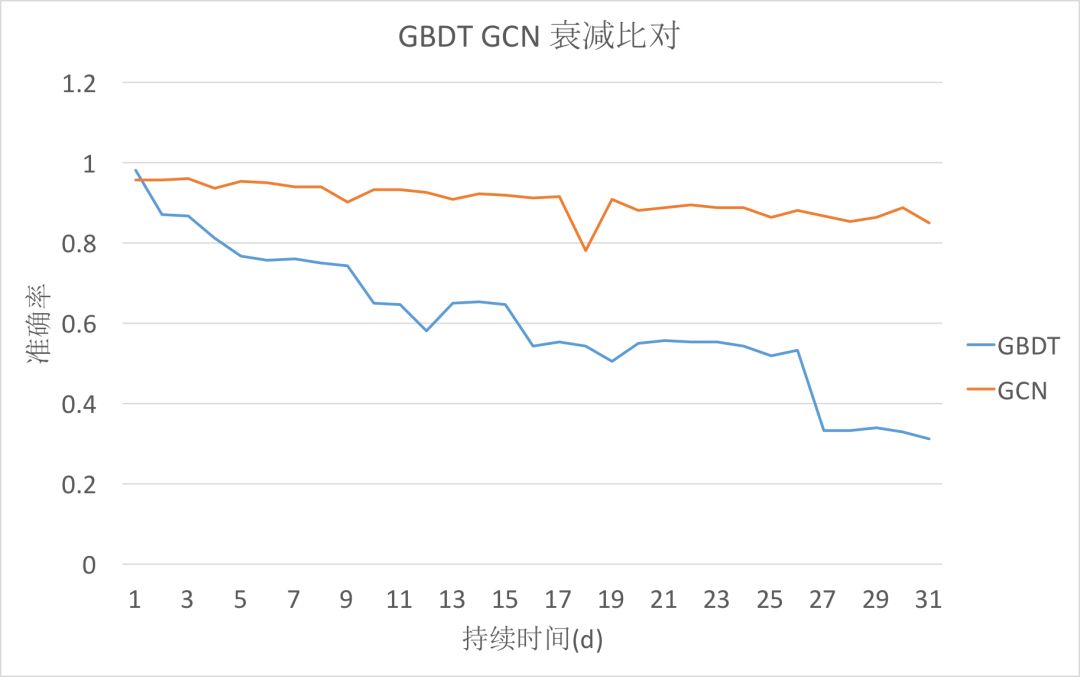
The accuracy decay of the GCN model is relatively small, while the decay of GBDT is severe. It can be seen that the GCN model performs better in human-machine discrimination and has good robustness.
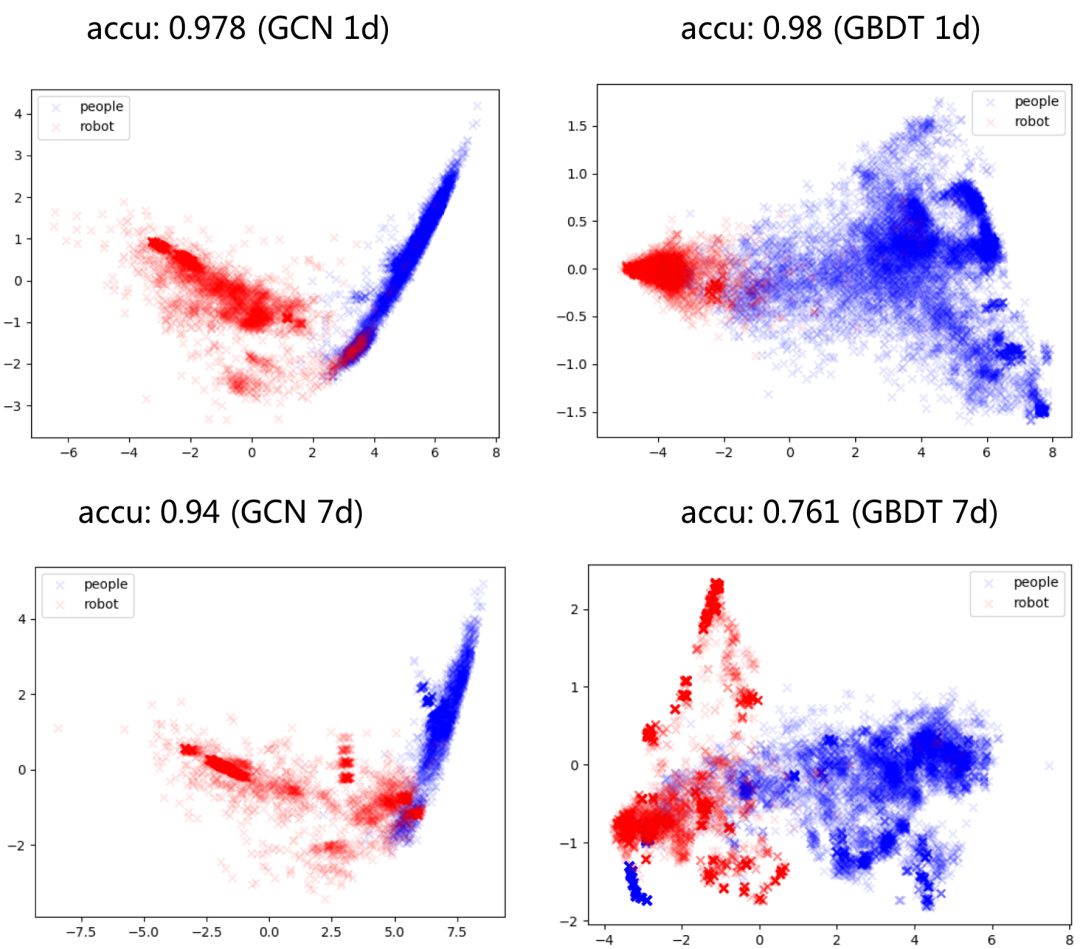
The evaluation effect visualization on day 7 (using the data from the first day to train the model and observing its prediction effect and the last layer’s output tsne visualization results on day 7). The above shows that the GCN maintains a clear boundary for sample discrimination on day 7, while the GBDT’s boundary has become very blurry. In summary, the structural information learned by GCN not only performs well in human-machine discrimination but also exhibits better robustness.
This article is part of the Machine Heart column, please contact this public account for authorization if reprinted.
✄————————————————
Join Machine Heart (Full-time reporter / Intern): [email protected]
Submissions or inquiries: content@jiqizhixin.com
Advertising & Business Cooperation: [email protected]