Translator: Ahong
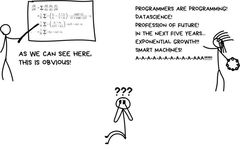
Everyone is talking about machine learning, but very few people can explain what it really is, apart from the teachers who know it inside out. If you read articles about machine learning online, you are likely to encounter two scenarios: heavy academic tracts filled with various theorems (I struggle to grasp even half of a theorem), or extravagant tales about artificial intelligence, data science magic, and the future of work.
I decided to write a long-awaited article to provide a simple introduction to those who want to understand machine learning. This will not involve advanced principles, but will use simple language to discuss real-world problems and practical solutions. Whether you are a programmer or a manager, you will be able to understand. So, let’s get started!
Why Do We Want Machines to Learn?
Now, let’s introduce Billy. Billy wants to buy a car and wants to figure out how much he needs to save each month to afford it. After browsing dozens of ads online, he learns that a new car costs around $20,000, a one-year-old used car costs $19,000, and a two-year-old car costs $18,000, and so on.
As a smart analyst, Billy discovers a pattern: the price of the car depends on its age; for each additional year, the price decreases by $1,000, but it will not go below $10,000.
In machine learning terms, Billy has invented “regression”—predicting a value (price) based on known historical data. When people try to estimate a reasonable price for a used iPhone on eBay or calculate how many ribs to prepare for a barbecue party, they are using a method similar to Billy’s—200g per person? 500?
Yes, if only there were a simple formula to solve all the world’s problems—especially for barbecues—unfortunately, that is not possible.
Let’s return to the car-buying scenario. Now the problem is, besides age, there are different production dates, dozens of accessories, technical conditions, seasonal demand fluctuations… who knows what other hidden factors there are… Ordinary Billy cannot consider all this data when calculating the price, and neither can I.
People are lazy and dumb—we need robots to help them do the math. Therefore, here we use computer methods—provide the machine with some data and let it find all the potential patterns related to the price.
Finally, it works! The most exciting thing is that compared to a human carefully analyzing all the dependent factors in their mind, the machine does it much better.
Thus, machine learning is born.
The 3 Components of Machine Learning
Setting aside all the nonsense related to artificial intelligence (AI), the only goal of machine learning is to predict results based on the input data, that’s it. All machine learning tasks can be expressed this way; otherwise, it wouldn’t be a machine learning problem from the start.
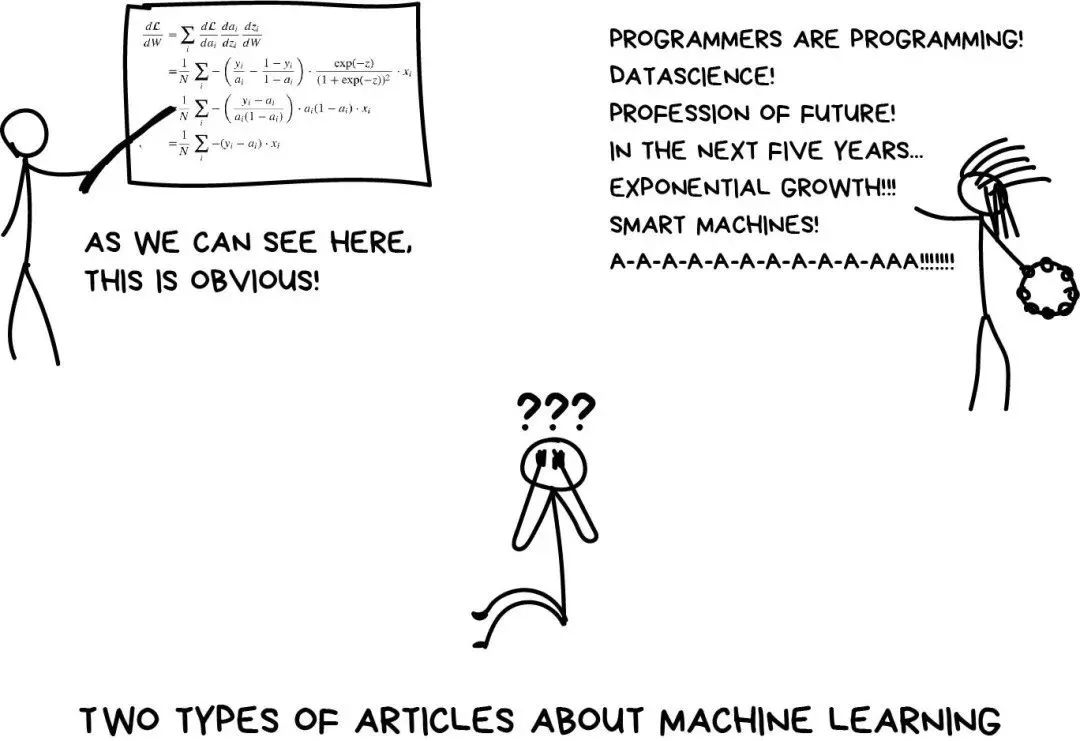
The more diverse the samples, the easier it is to find related patterns and predict results. Therefore, we need three components to train the machine:
(1) Data
Want to detect spam? Get samples of spam messages. Want to predict stocks? Find historical price information. Want to figure out user preferences? Analyze their activity records on Facebook (no, Mark, stop collecting data—it’s enough). The more diverse the data, the better the results. For a machine that is working hard, it needs at least hundreds of thousands of lines of data.
There are two main ways to obtain data—manually or automatically. Manually collected data has fewer mixed errors but takes more time—usually it costs more too. Automated methods are relatively cheap; you can collect all the data you can find (hopefully the data quality is good).
Some smart guys like Google utilize their users to label data for free; remember ReCaptcha (human verification) forcing you to “select all the road signs”? That’s how they collect data, still free labor! Well done. If I were them, I would show those verification images more often, but wait…
Good datasets are really hard to obtain; they are so important that some companies might even open their algorithms but rarely release their datasets.
(2) Features
Also known as “parameters” or “variables”, such as the mileage of a car, user gender, stock prices, word frequency in documents, etc. In other words, these are the factors the machine needs to consider. If the data is stored in a tabular format, features correspond to column names, which is relatively simple. But what if it’s 100GB of cat images? We can’t treat every pixel as a feature. This is why choosing appropriate features often takes more time than other steps in machine learning, and feature selection is also a major source of error. The subjective tendency of human nature leads people to choose features they like or feel are “more important”—this should be avoided.
(3) Algorithms
The most obvious part. Any problem can be solved in different ways. The method you choose will affect the final model’s accuracy, performance, and size. One thing to note: if the data quality is poor, even the best algorithm will not help. This is known as “garbage in, garbage out” (GIGO). Therefore, before putting a lot of thought into accuracy, more data should be obtained.
Learning Vs. Intelligence
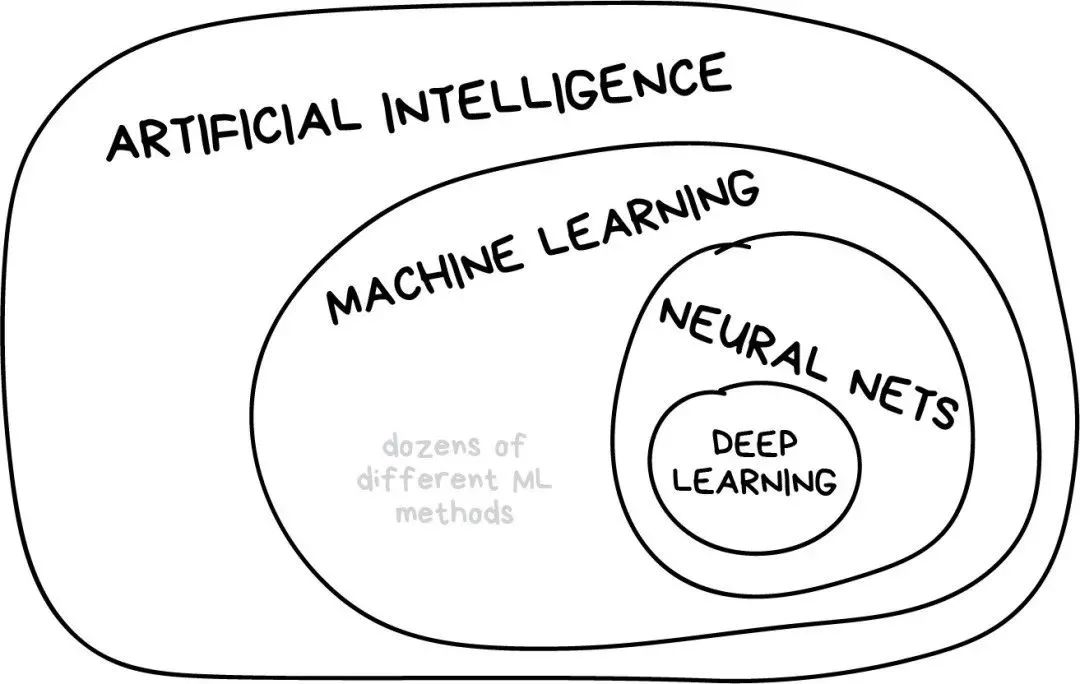
I once saw an article titled “Will Neural Networks Replace Machine Learning?” on some popular media sites. These journalists always inexplicably exaggerate techniques like linear regression to “artificial intelligence”, almost calling it “Skynet”. The following image shows the relationship between several easily confused concepts.
-
“Artificial Intelligence” is the name of the entire discipline, similar to “Biology” or “Chemistry”.
-
“Machine Learning” is an important component of “artificial intelligence”, but not the only part.
-
“Neural Networks” is a branch method of machine learning, which is quite popular, but there are other branches under the machine learning family.
-
“Deep Learning” is a modern method of building, training, and using neural networks. Essentially, it is a new architecture. In current practice, no one distinguishes between deep learning and “ordinary networks”; the libraries called upon when using them are the same. To avoid looking like a fool, you better specify the exact type of network and avoid buzzwords.
The general principle is to compare things at the same level. That’s why saying “neural networks will replace machine learning” sounds like “wheels will replace cars”. Dear media, this will damage a large part of your reputation.
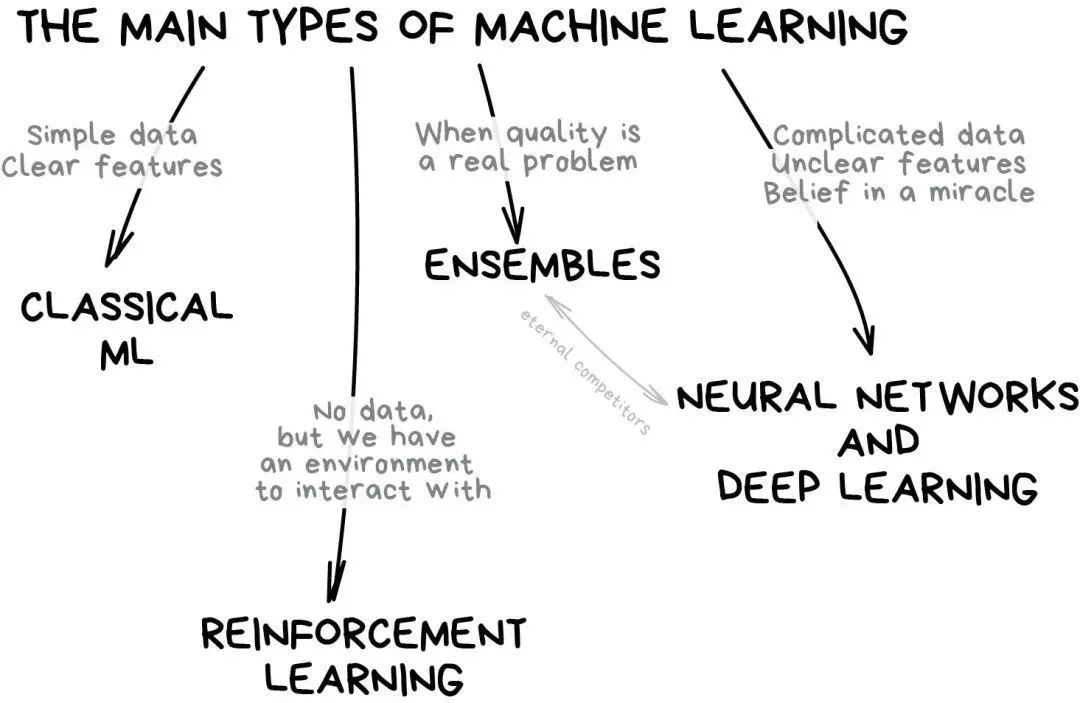
The Landscape of Machine Learning
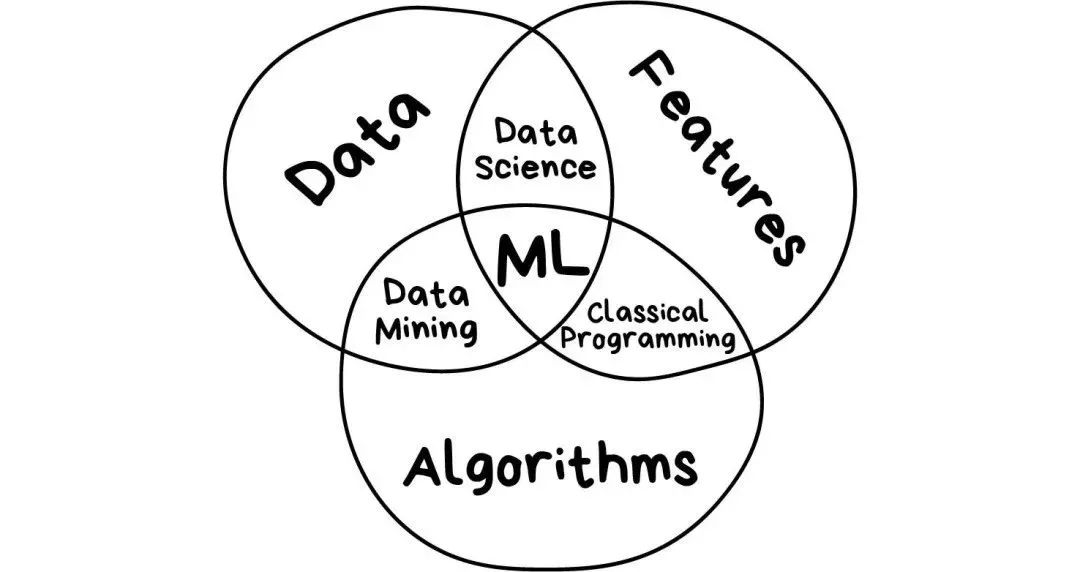
If you are too lazy to read long texts, the following image helps to gain some understanding.
In the world of machine learning, there is never just one way to solve a problem—remember this—it’s because you will always find several algorithms that can be used to solve a particular problem, and you need to choose the one that fits best. Of course, all problems can be handled with “neural networks”, but who will bear the hardware costs that support the computational power behind it?
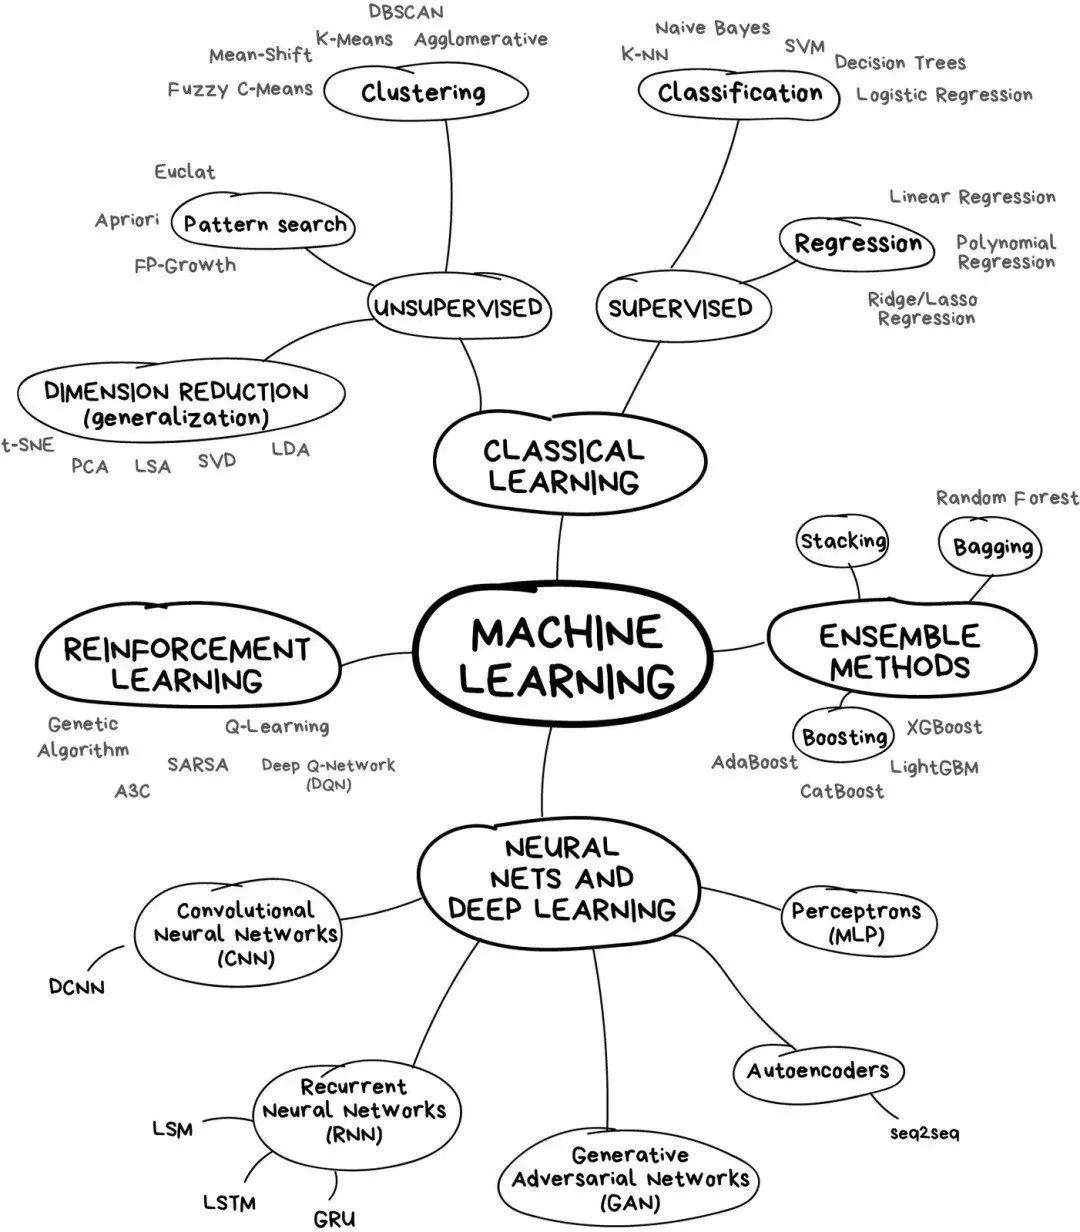
Let’s start with some basic overviews. Currently, machine learning mainly has four directions.
Part 1: Classic Machine Learning Algorithms
Classic machine learning algorithms originated from pure statistics in the 1950s. Statisticians solved formal math problems such as finding patterns in numbers, estimating distances between data points, and calculating vector directions.
Today, half of the internet is studying these algorithms. When you see a column of “continue reading” articles, or find your bank card locked at some remote gas station, it’s likely one of these little guys at work.
Large tech companies are loyal proponents of neural networks. The reason is obvious; for these large enterprises, a 2% increase in accuracy means an additional $2 billion in revenue. However, when a company is small, it’s not that important. I heard of a team that spent a year developing a new recommendation algorithm for their e-commerce site, only to find that 99% of their traffic came from search engines—making their algorithm useless since most users didn’t even open the homepage.
Although classic algorithms are widely used, their principles are quite simple; you can easily explain them to a toddler. They are like basic arithmetic—we use them every day without even thinking about it.
1.1 Supervised Learning
Classic machine learning is usually divided into two categories: supervised learning and unsupervised learning.
In “supervised learning,” there is a “supervisor” or “teacher” who provides the machine with all the answers to assist learning, such as whether the image is a cat or a dog. The “teacher” has already completed the dataset division—labeling it as “cat” or “dog”—and the machine uses these example data to learn to distinguish between cats and dogs.
Unsupervised learning means the machine completes the task of distinguishing who is who among a pile of animal images on its own. The data is not pre-labeled, and there is no “teacher”; the machine has to find all possible patterns on its own. This will be discussed later.
Clearly, when there is a “teacher” present, the machine learns faster, which is why supervised learning is more commonly used in real life.
Supervised learning is divided into two categories:
-
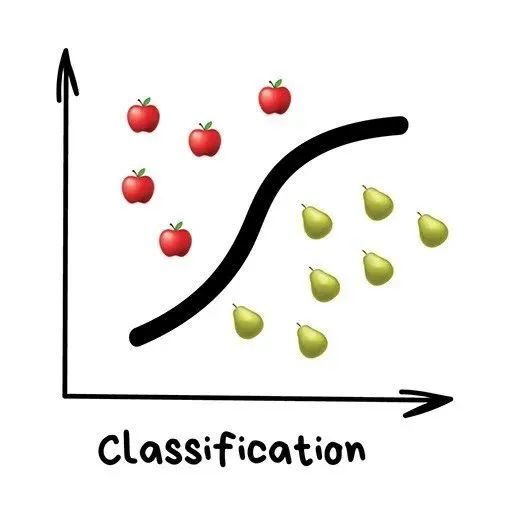
Classification, predicting the category an object belongs to;
-
Regression, predicting a specific point on a number line;
“Classifying objects based on a known attribute, such as categorizing socks by color, classifying documents by language, or dividing music by style.”
Classification algorithms are commonly used for:
-
-
-
Finding similar documents;
-
-
Recognizing handwritten letters or numbers;
-
Common algorithms include:
Machine learning primarily solves “classification” problems. This machine is like a toddler learning to classify toys: this is a “robot,” this is a “car,” this is a “machine-car”… uh, wait, error! Error!
In classification tasks, you need a “teacher.” The data needs to be pre-labeled so that the machine can learn to classify based on these labels. Everything can be classified—users can be classified based on interests, articles can be classified based on language and topic (which is important for search engines), and music can be classified based on type (Spotify playlists); your emails are no exception.
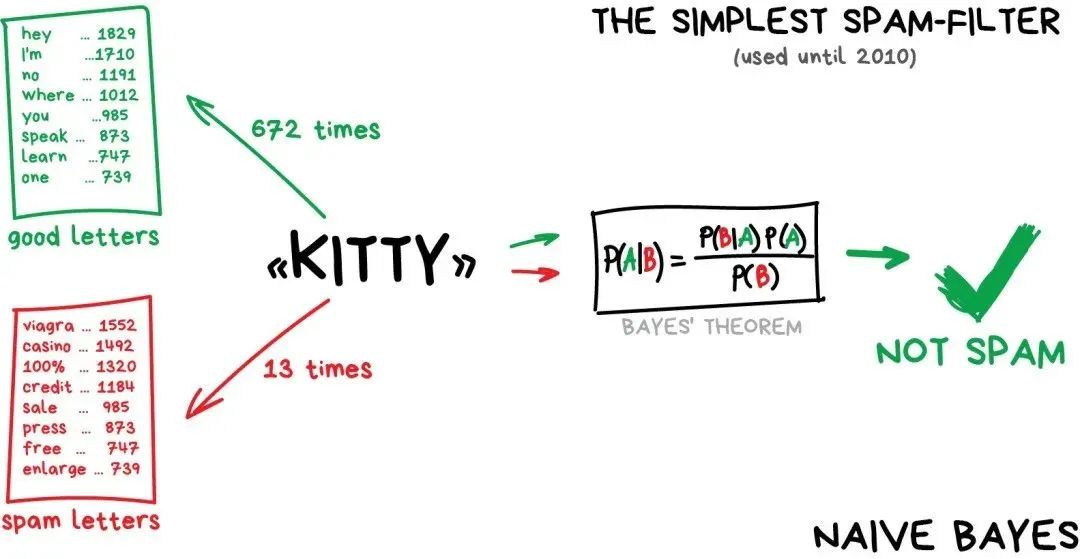
The Naive Bayes algorithm is widely used in spam filtering. The machine counts the frequency of terms like “Viagra” appearing in spam and normal emails, then applies Bayes’ theorem multiplied by their respective probabilities, and sums the results—ha, the machine has learned.
Later, spam creators learned how to deal with Bayesian filters—by adding many “good” words at the end of the email content—this method is ironically called “Bayesian poisoning.” Naive Bayes is recorded in history as the most elegant and the first practical algorithm, but now there are other algorithms to handle spam filtering issues.
Let’s take another example of a classification algorithm.
If you need to borrow some money now, how does the bank know if you will pay it back in the future? They can’t be sure. However, the bank has many historical records of borrowers, with data such as “age,” “education level,” “occupation,” “salary,” and—most importantly—“whether they paid back.”
Using this data, we can train the machine to find patterns and come up with answers. Finding the answer is not the problem; the issue is that the bank cannot blindly trust the answers given by the machine. What if the system fails, gets hacked, or a tipsy graduate just patched it up?
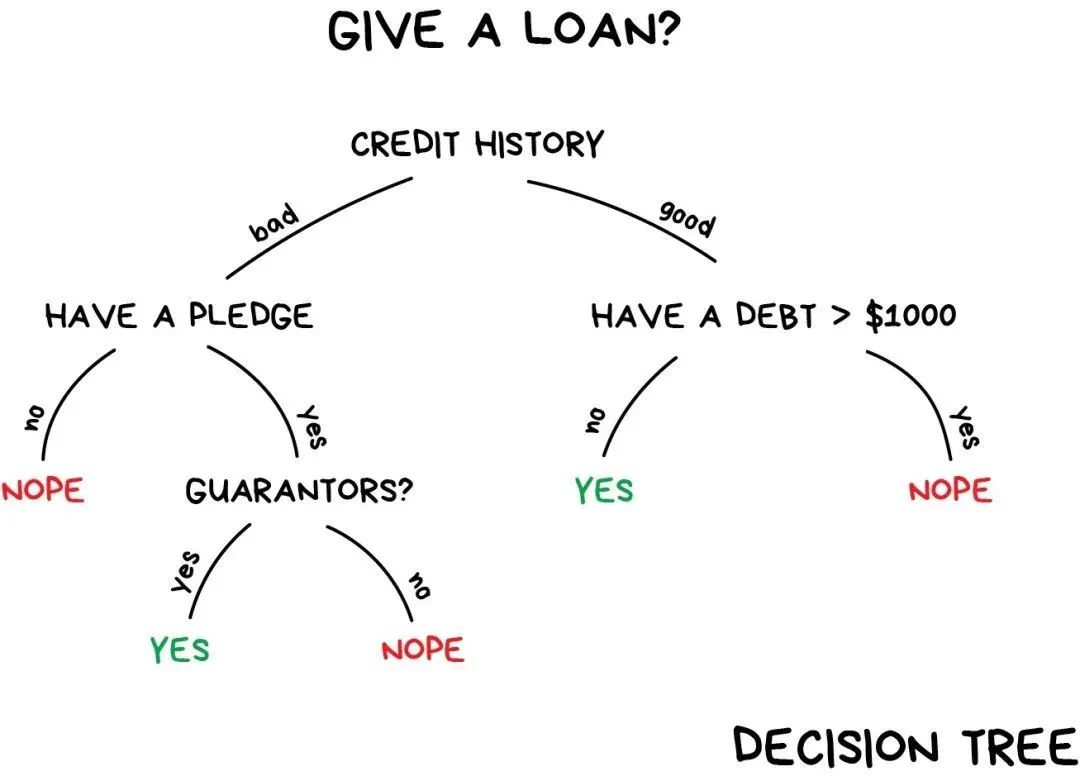
To address this issue, we need to use decision trees; all data is automatically divided into “yes/no” questions—such as “Does the borrower’s income exceed $128.12?”—it sounds a bit inhumane. However, the machine generates such questions to optimally partition the data at each step.
That’s how the “tree” is generated. The higher the branches (closer to the root node), the broader the range of questions. All analysts can accept this approach and provide explanations afterward, even if they do not understand how the algorithm works; they can still easily explain the results (typical analysts!).
Decision trees are widely used in high-stakes scenarios: diagnostics, medicine, and finance.
The two most well-known decision tree algorithms are CART and C4.5.
Nowadays, pure decision tree algorithms are seldom used. However, they are the foundation of large systems, and the performance of decision trees after integration can even outperform neural networks. We will discuss this later.
When you search on Google, a bunch of clumsy “trees” are helping you find answers. Search engines like these algorithms because they run fast.
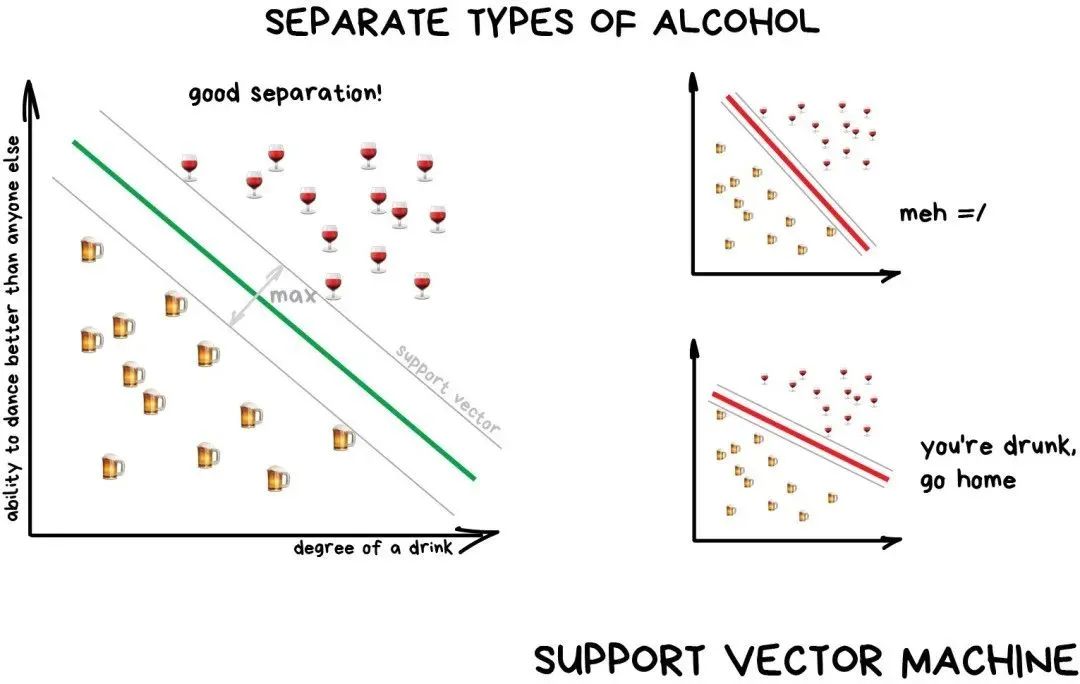
In theory, Support Vector Machines (SVM) should be the most popular classification method. Anything that exists can be classified using it: classifying plants by shape in images, classifying documents by category, etc.
The idea behind SVM is simple—it tries to draw two lines between data points and maximize the distance between the two lines as much as possible.
Classification algorithms have a very useful scenario—anomaly detection. If a certain feature cannot be assigned to any category, we mark it. This method is now used in the medical field—MRI (Magnetic Resonance Imaging), where the computer marks all suspicious areas or deviations within the detection range. The stock market uses it to detect traders’ abnormal behavior to find insiders. While training the computer to distinguish what is correct, we also automatically teach it to recognize what is incorrect.
The rule of thumb is that the more complex the data, the more complex the algorithm. For text, numbers, and tables, I would choose classic methods to operate. These models are smaller, learn faster, and have clearer workflows. For images, videos, and other complex big data, I would definitely explore neural networks.
Just five years ago, you could still find SVM-based face classifiers. Now, it’s easier to pick a model from hundreds of pre-trained neural network models. However, spam filters have not changed; they still use SVM, and there’s no reason to change it. Even my website uses SVM to filter spam comments.
Regression
“Draw a line through these points, hmm~ this is machine learning”
Regression algorithms are currently used for:
-
-
Supply and sales volume analysis
-
-
Calculating time series correlations
Common regression algorithms include:
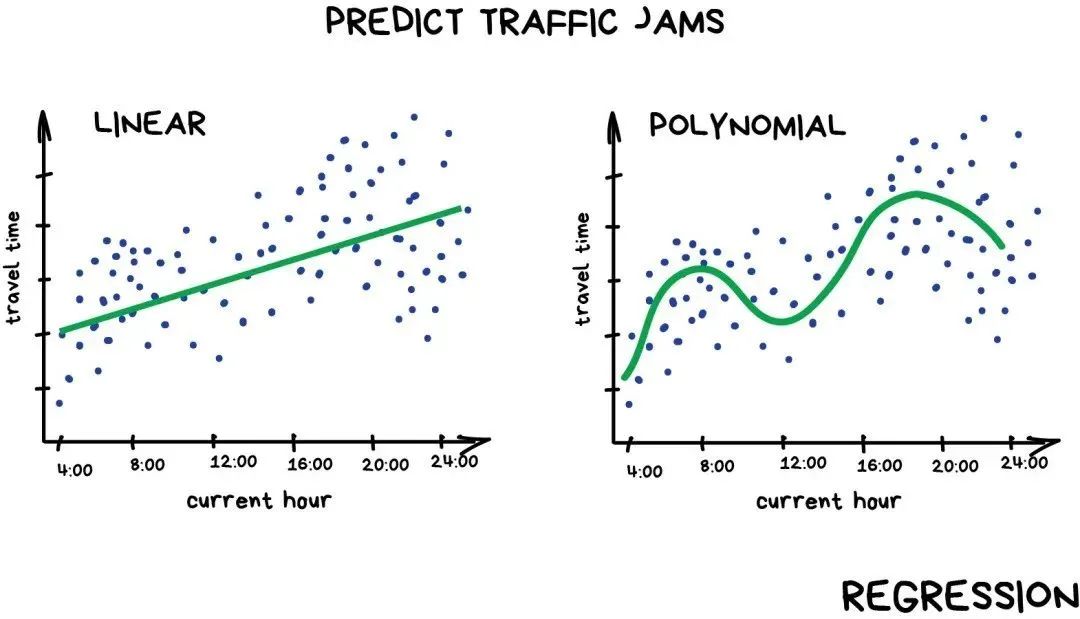
The “regression” algorithm is essentially a “classification” algorithm, except that it predicts a value instead of a category. For example, predicting the price of a car based on mileage, estimating traffic volume at different times of the day, and predicting the extent of supply changes as a company grows, etc. When dealing with time-related tasks, regression algorithms are undoubtedly the best choice.
Regression algorithms are favored by professionals in the finance or analytics industry. It has even become a built-in feature in Excel, making the entire process very smooth—the machine simply tries to draw a line representing the average correlation. However, unlike a person with a pen and whiteboard, the machine does this through mathematical precision by calculating the average distance of each point from the line.
If the drawn line is straight, it is “linear regression”; if the line is curved, it is “polynomial regression.” They are the two main types of regression. Other types are relatively rare. Don’t be fooled by the “Logistics regression” which is a “bad apple”; it is a classification algorithm, not regression.
However, it’s okay to mix up “regression” and “classification.” Some classifiers can turn into regressors after adjusting parameters. Besides defining the category of an object, remember how close the object is to that category, which leads to regression problems.
If you want to dive deeper, you can read the article “Machine Learning for Humans” [1] (highly recommended).
1.2 Unsupervised Learning
Unsupervised learning appeared slightly later than supervised learning—in the 1990s, this type of algorithm was used relatively less, sometimes just because there were no options.
Having labeled data is a luxury. Suppose I want to create a—let’s say “bus classifier,” do I have to personally take millions of photos of those damn buses on the street and label each of those images? No way, that would take my lifetime; I still have many games to play on Steam.
In this case, we still have to have a little hope in capitalism, thanks to the social crowd-sourcing mechanism, we can get millions of cheap labor and services. For example, Mechanical Turk [2], which has a group of people ready to help you complete tasks for $0.05. That’s usually how it gets done.
Or, you can try using unsupervised learning. But I don’t remember any best practices regarding it. Unsupervised learning is usually used for exploratory data analysis, rather than as a primary algorithm. Those with degrees from Oxford and special training feed a large amount of garbage to the machine and start observing: are there any clusters? No. Can any connections be seen? No. Well, next, you still want to pursue a data science job, right?
Clustering
“The machine will choose the best way to distinguish things based on some unknown features.”
Clustering algorithms are currently used for:
-
Market segmentation (customer types, loyalty)
-
Merging nearby points on a map
-
-
Analyzing and labeling new data
-
Detecting abnormal behavior
Common algorithms include:
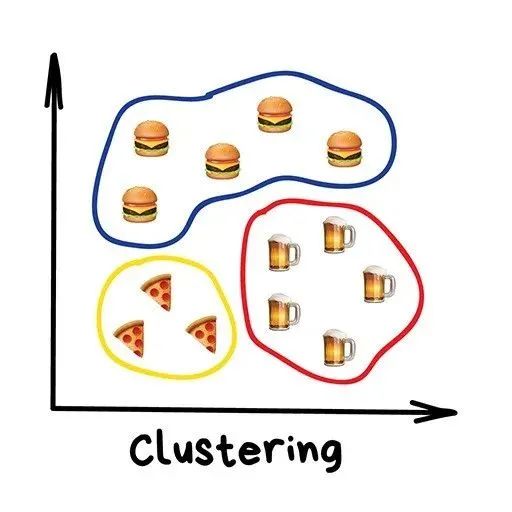
Clustering is done without pre-labeling categories. It’s like categorizing socks when you don’t remember all their colors. Clustering algorithms try to find similar things (based on certain features) and then group them into clusters. Objects with many similar features cluster together and are assigned to the same category. Some algorithms even support setting the exact number of data points in each cluster.
Here is a good example of clustering—markers on online maps. When you search for vegetarian restaurants nearby, the clustering engine groups them and displays them with numbered bubbles. If not, the browser would freeze—because it tries to plot all 300 vegetarian restaurants in this trendy city on the map.
Apple Photos and Google Photos use more complex clustering methods. They create albums of your friends by searching for faces in photos. The application doesn’t know how many friends you have or what they look like, but can still find common facial features among them. This is typical clustering.
Another common application is image compression. When images are saved in PNG format, colors can be set to 32 colors. This means the clustering algorithm must find all the “red” pixels, calculate the “average red,” and assign this average to all red pixels. Fewer colors result in smaller files—cost-effective!
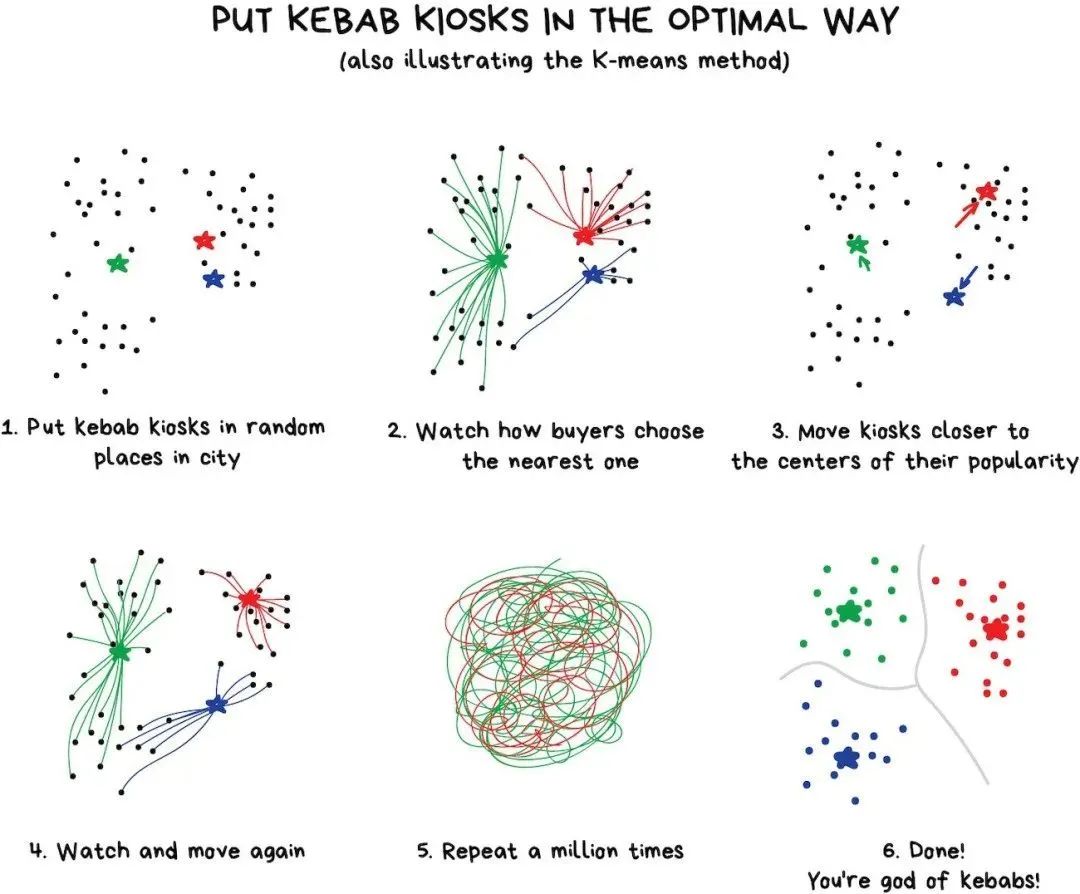
However, when faced with colors like blue and green, it becomes tricky. Is it green or blue? This is when the K-Means algorithm comes into play.
First, randomly select 32 color points as “cluster centers” from the colors, and then label the remaining points according to the nearest cluster center. This gives us “star clusters” around the 32 color points. Next, we move the cluster centers to the center of the “star clusters” and repeat the above steps until the cluster centers no longer move.
Done. Exactly 32 stable clusters have been formed.
Let me show you a real-life example:
Finding cluster centers is convenient, but real-life clusters are not always circular. Suppose you are a geologist and need to find some similar ores on a map. In this case, the shape of the clusters may be strange, even nested. You might not even know how many clusters there will be—10? 100?
K-means algorithms may not work here, but DBSCAN algorithms can. We compare data points to people in a square and ask any three people standing close to hold hands. Next, we tell them to hold hands with any neighbors they can reach (the positions of people cannot move during the entire process), and repeat this process until new neighbors join in. This gives us the first cluster, and we repeat the above process until everyone is assigned to a cluster. Done.
An unexpected gain: a person who is not holding hands—an anomaly.
The whole process looks cool.
Interested in learning more about clustering algorithms? You can read this article “5 Clustering Algorithms Every Data Scientist Needs to Know” [3].
Like classification algorithms, clustering can be used to detect anomalies. If a user performs abnormal operations after logging in, let the machine temporarily disable their account and create a ticket for technical support to check what’s going on. Perhaps they are a “robot.” We don’t even need to know what “normal behavior” looks like; we just need to pass the user’s behavioral data to the model and let the machine decide if they are a “typical” user. Although this method is not as effective as classification algorithms, it’s still worth trying.
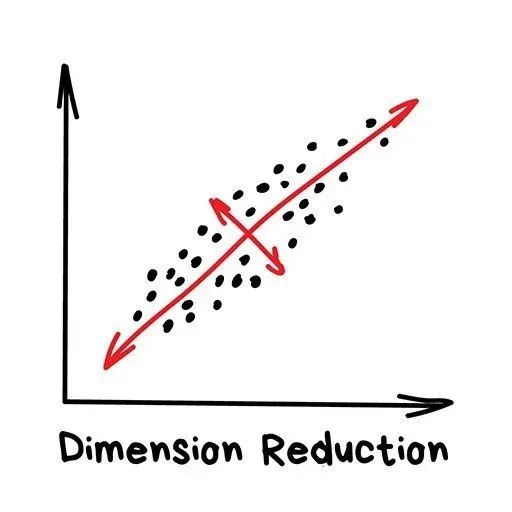
Dimensionality Reduction
“Assembling specific features into higher-level features”
“Dimensionality reduction” algorithms are currently used for:
-
-
-
Topic modeling and finding similar documents
-
-
Common “dimensionality reduction” algorithms include:
-
Principal Component Analysis (PCA)
-
Singular Value Decomposition (SVD)
-
Latent Dirichlet Allocation (LDA)
-
Latent Semantic Analysis (LSA, pLSA, GLSA)
-
t-SNE (for visualization)
In earlier years, “hardcore” data scientists would use these methods, determined to find “interesting things” in a pile of numbers. When Excel charts didn’t work, they forced machines to do the pattern-finding work. Thus, they invented dimensionality reduction or feature learning methods.
 Projecting 2D data onto a straight line (PCA)
For people, abstract concepts are more convenient than a pile of fragmented features. For example, we can combine a dog with triangular ears, a long nose, and a big tail into the abstract concept of “sheepdog.” Compared to a specific sheepdog, we indeed lose some information, but the new abstract concept is more useful in scenarios where naming and explaining are needed. As a bonus, these “abstract” models learn faster, use fewer features during training, and also reduce overfitting.
Projecting 2D data onto a straight line (PCA)
For people, abstract concepts are more convenient than a pile of fragmented features. For example, we can combine a dog with triangular ears, a long nose, and a big tail into the abstract concept of “sheepdog.” Compared to a specific sheepdog, we indeed lose some information, but the new abstract concept is more useful in scenarios where naming and explaining are needed. As a bonus, these “abstract” models learn faster, use fewer features during training, and also reduce overfitting.
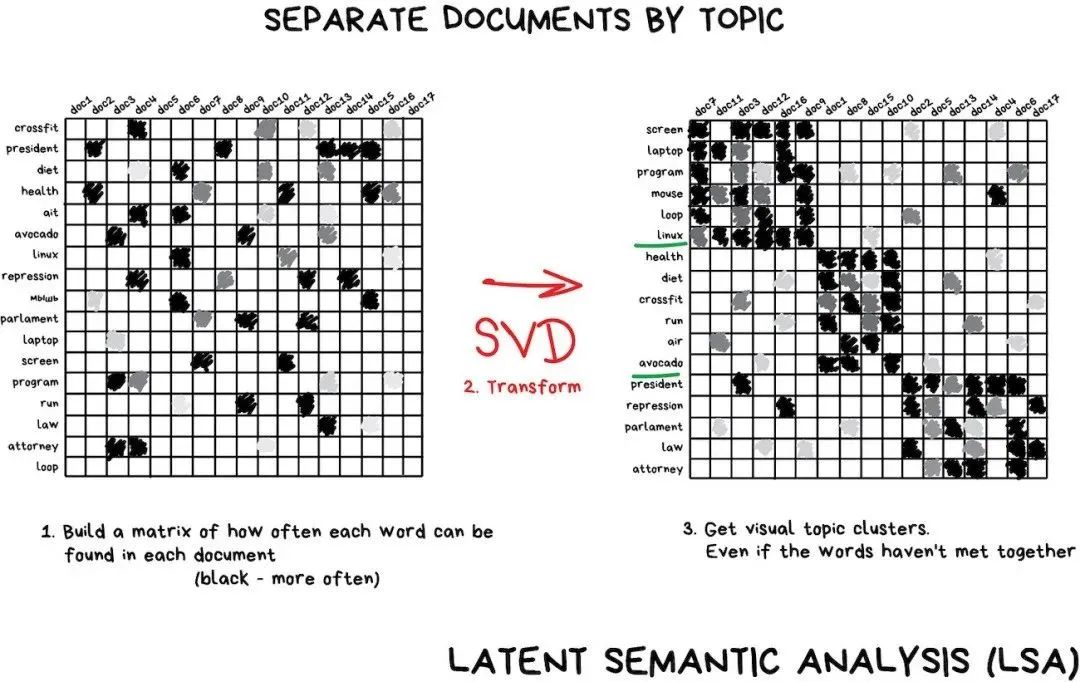
These algorithms can shine in the task of “topic modeling.” We can abstract meanings from specific phrases. Latent Semantic Analysis (LSA) does this, based on the frequency of specific words you can see on a certain topic. For instance, technology articles will likely contain more technology-related vocabulary, or the names of politicians mostly appear in politically relevant news, and so on.
We could directly create clusters from all the words in all articles, but doing so would lose all important connections (for example, in different articles, battery and accumulator mean the same thing), and LSA can handle this well, hence it’s called “latent semantic.”
Therefore, it is necessary to connect words and documents into a feature that maintains their latent connections—people have discovered that singular value decomposition (SVD) can solve this problem. Those useful topic clusters can easily be seen from the words that cluster together.
Recommendation systems and collaborative filtering are another high-frequency area where dimensionality reduction algorithms are used. If you extract information from user ratings, you will get a great system to recommend movies, music, games, or anything else you want.
Here’s a book I love, “Programming Collective Intelligence”; it was my bedside book during college.
It’s nearly impossible to fully understand this kind of abstraction on machines, but you can keep an eye on some correlations: some abstract concepts are related to user age—children play “Minecraft” or watch cartoons more, while others may relate to movie styles or user preferences.
Based solely on user ratings, machines can identify these high-level concepts without even needing to understand them. Well done, Mr. Computer. Now we can write a paper on “Why Bearded Lumberjacks Love My Little Pony.”
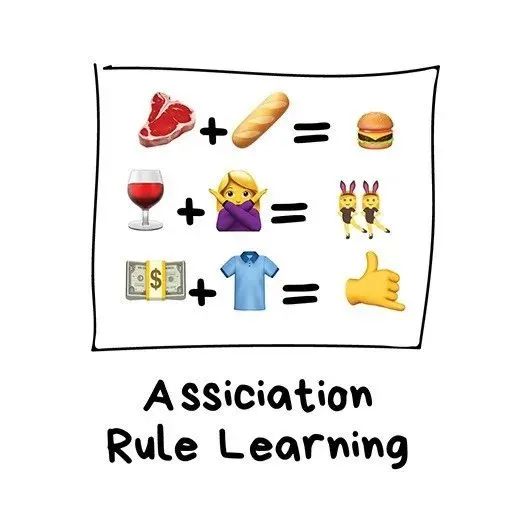
Association Rule Learning
“Finding patterns in the order flow”
“Association rules” are currently used for:
-
Predicting sales and discounts
-
Analyzing “items bought together”
-
Planning product displays
-
Analyzing web browsing patterns
Common algorithms include:
Algorithms used to analyze shopping carts, automate marketing strategies, and other event-related tasks are here. If you want to discover some patterns from a sequence of items, give them a try.
For example, a customer takes a six-pack of beer to the checkout. Should we place peanuts on the way to checkout? How often do people buy beer and peanuts together? Yes, association rules are likely applicable to the situation of beer and peanuts, but can we predict what other sequences? Can small changes in product layout lead to significant profit increases?
This idea is also applicable to e-commerce, where the tasks are even more interesting—what will the customer buy next?
I don’t know why rule learning seems to be rarely mentioned in the realm of machine learning. The classic method applies trees or ensemble methods based on a positive examination of all purchased items. The algorithm can only search for patterns but cannot generalize or reproduce these patterns in new examples.
In the real world, every large retailer has established its own exclusive solution, so this will not bring you a revolution. The highest-level technology mentioned in this article is the recommendation system. However, I might not be aware of any breakthroughs in this area. If you have anything to share, please let me know in the comments.
Original: https://valyrics.vas3k.com/blog/machine_learning
More Exciting:
Yan Shi │ Thoughts and Suggestions on the “Dilemma” of Young Teachers in Higher Education
【Directory】 “Computer Education” 2022 Issue 9
【Directory】 “Computer Education” 2022 Issue 8
【Directory】 “Computer Education” 2022 Issue 7
【Directory】 “Computer Education” 2022 Issue 6
【Directory】 “Computer Education” 2022 Issue 5
【Editorial Message】 Professor Li Xiaoming from Peking University: Reflections on the “Year of Classroom Teaching Improvement”…
Professor Chen Daoxu from Nanjing University: Which is more important, teaching students to ask questions or teaching students to answer questions?
【Yan Shi Series】: Trends in Computer Science Development and Their Impact on Computer Education
Professor Li Xiaoming from Peking University: From Interesting Mathematics to Interesting Algorithms to Interesting Programming—A Path for Non-Professional Learners to Experience Computational Thinking?
Reflections on Several Issues in Building a First-Class Computer Science Discipline
New Engineering and Big Data Major Construction
Lessons from Others Can Be Used for Reference—Compilation of Research Articles on Computer Education in China and Abroad