Author: Mathieu Carrière
Translator: Sun Taochun
Proofreader: He Zhonghua
This article is approximately 4500 words long and is recommended to be read in 10minutes.
This article briefly introduces the power of Topological Data Analysis (TDA) in machine learning and demonstrates how to practice with three Python libraries: Gudhi, Scikit-Learn, and Tensorflow.
Hi everyone.Today, I want to emphasize the power of Topological Data Analysis (TDA) in machine learning and show how to practice with three Python libraries: Gudhi, Scikit-Learn, and Tensorflow.
What is Topological Data Analysis?
First, let’s talk about TDA.It is a relatively niche area in data science, especially when compared to machine learning and deep learning.However, it is rapidly growing and catching the attention of data scientists.Many startups and companies are actively integrating these techniques into their toolboxes (such as IBM, Fujitsu, Ayasdi) due to its success in various application fields in recent years, including biology, time series, finance, scientific visualization, and computer graphics.I may write a post in the future about the general uses and best practices of TDA, so stay tuned.
TDA:
https://en.wikipedia.org/wiki/Topological_data_analysis
IBM:
https://researcher.watson.ibm.com/researcher/view_group.php?id=6585
Fujitsu:
https://www.fujitsu.com/global/about/resources/news/press-releases/2016/0216-01.html
Ayasdi:
https://www.ayasdi.com/platform/technology/
Biology:
https://www.ncbi.nlm.nih.gov/pubmed/28459448
Time Series:
https://www.ams.org/journals/notices/201905/rnoti-p686.pdf
Finance:
https://papers.ssrn.com/sol3/papers.cfm?abstract_id=2931836
Scientific Visualization:
https://topology-tool-kit.github.io/
Computer Graphics:
http://www.lix.polytechnique.fr/~maks/papers/top_opt_SGP18.pdf
The goal of TDA is to compute and encode the topological properties of your data, which means recording the diverse connected components, loops, cavities, and high-dimensional structures in the dataset.This is very useful mainly because other descriptors cannot compute this kind of information.So TDA really stores a set of data features that you cannot find elsewhere.The reality is that these features have been shown to be useful for enhancing the predictive power of machine learning, so if you have never seen or heard of these features before, let me give you a quick overview.
I have written many articles on this topic, and you can find many other posts about TDA on Medium, so I am not going to waste time on mathematical definitions; instead, I will demonstrate how to apply TDA on your dataset by explaining typical examples from the TDA literature.
https://towardsdatascience.com/mixing-topology-and-deep-learning-with-perslay-2e60af69c321
https://towardsdatascience.com/applied-topological-data-analysis-to-deep-learning-hands-on-arrhythmia-classification-48993d78f9e6
Reference Example of TDA:Point Cloud Classification
This dataset was introduced in a pioneering TDA paper. It consists of a collection of point clouds generated by trajectories obtained through the following dynamical system:
http://jmlr.org/papers/v18/16-337.html
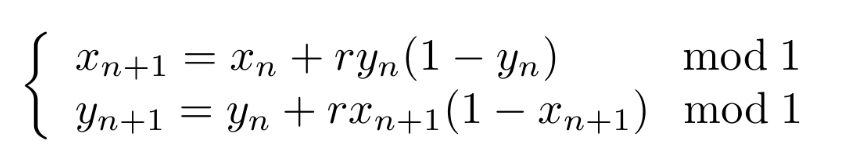
An equation of a dynamical system
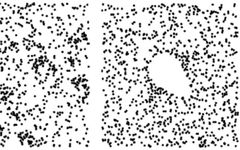
This means we will randomly sample an initial point within a unit square and generate a sequence of points through the equation above. This will give us a point cloud. Now we can repeat this operation as desired to obtain a bunch of point clouds. An interesting property of these point clouds is that depending on the value of the r parameter used to generate the point sequence, the point clouds can have very different and interesting structures. For example, if r=3.5, the resulting point cloud seems to cover the entire unit square, but if r=4.1, some areas of the unit square are empty: in other words, there are many holes in your point cloud. This is good news for us: TDA can directly compute whether these structures can occur.

Point clouds calculated for r=3.5 (left) and r=4.1 (right). It is quite obvious that the latter has a hole, while the former does not.
TDA tracks these holes in a rather simple way. Imagine a ball centered at each point in your point cloud with a radius of R. If R=0, the union of these balls is the point cloud itself. If R is infinite, the union of the balls is the entire unit square. But if R is chosen carefully, the union of the balls may contain many topological structures, such as holes.
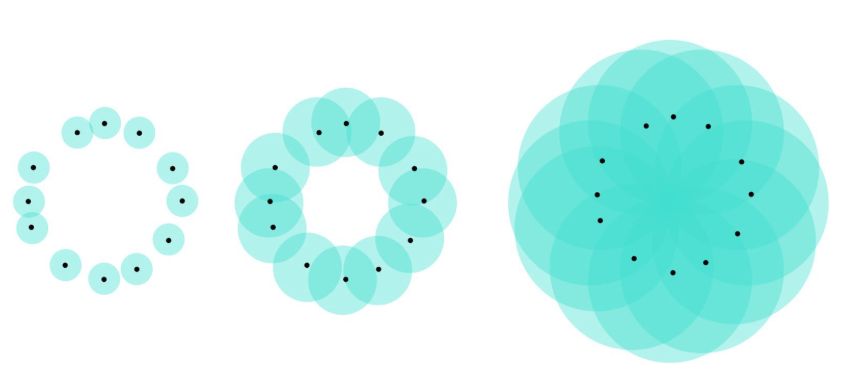
An example of the union of balls. For the union of the middle image, it clearly forms a hole. The entire image is shamelessly borrowed from one of my previous posts.
https://towardsdatascience.com/a-concrete-application-of-topological-data-analysis-86b89aa27586
So, to avoid manually selecting a “good value” for R, TDA will compute the union of balls for every possible value of R (from 0 to infinity) and record the radius at which each hole appears or disappears, and use these radius values as two-dimensional coordinates for some points. The output of TDA is another point cloud where each point represents a hole: this is called a Rips persistence diagram. Assuming the point cloud is stored in a numpy array X (shape N*2), this diagram can be computed with two lines of code using Gudhi:
import gudhi
rips = gudhi.RipsComplex(points=X).create_simplex_tree()
dgm = rips.persistence()

This beautiful persistence diagram is computed from the point cloud corresponding to r=4.1.The red points represent connected components, while the blue points represent holes.
The next task we will solve is to predict the value of r given the point cloud.
Topological Machine Learning with Gudhi + Scikit-Learn
Persistence diagrams are concise, aren’t they? Their problem is that persistence diagrams computed from different point clouds may have different numbers of points (because the point clouds may have different numbers of holes). So if you want to predict r from persistence diagrams using Scikit-Learn, unfortunately, there is no direct way to do this, as these libraries expect the input to be a structured vector. This is also why a lot of work currently focuses on transforming these persistence diagrams into fixed-length Euclidean vectors or developing corresponding kernels. That’s great, but which one should you use?
Don’t worry! Gudhi has a solution for you again. Through its representation module, you can not only compute all the vectors and kernels but also use Scikit-Learn for cross-validation and (or) to select the best one. It’s as simple as below:
Representation
https://gudhi.inria.fr/python/latest/representations.html
import gudhi.representations as tdafrom sklearn.pipeline import Pipelinefrom sklearn.svm import SVCfrom sklearn.ensemble import RandomForestClassifier as RFfrom sklearn.neighbors import KNeighborsClassifier as kNNfrom sklearn.model_selection import GridSearchCV
pipe = Pipeline([(“TDA”, tda.PersistenceImage()), (“Estimator”, SVC())])
param = [{“TDA”: [tda.SlicedWassersteinKernel()], “TDA__bandwidth”: [0.1, 1.0], “TDA__num_directions”: [20], “Estimator”: [SVC(kernel=”precomputed”)]}, {“TDA”: [tda.PersistenceWeightedGaussianKernel()], “TDA__bandwidth”: [0.1, 0.01], “TDA__weight”: [lambda x: np.arctan(x[1]-x[0])], “Estimator”: [SVC(kernel=”precomputed”)]}, {“TDA”: [tda.PersistenceImage()], “TDA__resolution”: [ [5,5], [6,6] ], “TDA__bandwidth”: [0.01, 0.1, 1.0, 10.0], “Estimator”: [SVC()]}, {“TDA”: [tda.Landscape()], “TDA__resolution”: [100], “Estimator”: [RF()]}, {“TDA”: [tda.BottleneckDistance()], “TDA__epsilon”: [0.1], “Estimator: [kNN(metric=”precomputed”)]} ]
model = GridSearchCV(pipe, param, cv=3)
model = model.fit(diagrams, labels)
In the previous code, I tried kernels SVM with Sliced Wasserstein kernel and Persistence Weighted Gaussian kernel, C-SVM with Persistence Images, Random Forest with Persistence Landscapes, and a simple KNN with the so-called Bottleneck Distance between persistence diagrams.There are many other possibilities in Gudhi, so be sure to give it a try!If you want to learn more details, you can also check Gudhi’s Tutorial.
Sliced Wasserstein Kernel:
http://proceedings.mlr.press/v70/carriere17a/carriere17a.pdf
Persistence Weighted Gaussian Kernel:
http://proceedings.mlr.press/v48/kusano16.html
Persistence Images:
http://jmlr.org/papers/v18/16-337.html
Persistence Landscapes:
http://www.jmlr.org/papers/volume16/bubenik15a/bubenik15a.pdf
Gudhi’s Tutorial:
https://github.com/GUDHI/TDA-tutorial/blob/master/Tuto-GUDHI-representations.ipynb
Topological Optimization with Gudhi and Tensorflow/Pytorch
I am sure you have now become a fan of TDA. If you still don’t believe it, I have something else for you, which is inspired by this paper. Imagine you now want to solve a more difficult problem: I want you to give me a point cloud whose persistence diagram has as many points as possible. In other words, you need to generate a point cloud with many holes.
https://arxiv.org/abs/1905.12200
I can see you sweating on your forehead. But I am kind-hearted, and I can let you know in no time that Gudhi (1) can do this. Think about it: when you generate a persistence diagram, the coordinates of different points in this diagram are not influenced by the entire initial point cloud, right? For a given point p in this persistence diagram, the coordinates of p depend only on the positions of the points in the initial point cloud that constitute the hole corresponding to p, in a simple way: these coordinates are just the radius at which this hole appears or disappears; or, equivalently, the maximum pairwise distance among these points. Gudhi (2) can find out these relationships through its persistence_pairs() function. The gradient can then be simply defined as the derivative of the Euclidean distance function (formal definition can be found in this paper).
Gudhi (1):
http://gudhi.gforge.inria.fr/python/latest/
Gudhi (2):
https://gudhi.inria.fr/python/latest/
This paper:
https://sites.google.com/view/hiraoka-lab-en/research/mathematical-research/continuation-of-point-cloud-data-via-persistence-diagram
Next, let’s write two functions: one to compute the Rips persistence diagram from a point cloud, and the other to compute the gradients of the persistence diagram points. For readability, I simplified a bit of the code; the actual code can be found here.
https://github.com/GUDHI/TDA-tutorial/blob/master/Tuto-GUDHI-optimization.ipynb
def compute_rips(x): rc = gd.RipsComplex(points=x) st = rc.create_simplex_tree() dgm = st.persistence() pairs = st.persistence_pairs() return [dgm, pairs]
def compute_rips_grad(grad_dgm, pairs, x): grad_x = np.zeros(x.shape, dtype=np.float32) for i in range(len(dgm)): [v0a, v0b] = pairs[i][0] [v1a, v1b] = pairs[i][1] grad_x[v0a,:]+=grad_dgm[i,0]*(x[v0a,:]-x[v0b,:])/val0 grad_x[v0b,:]+=grad_dgm[i,0]*(x[v0b,:]-x[v0a,:])/val0 grad_x[v1a,:]+=grad_dgm[i,1]*(x[v1a,:]-x[v1b,:])/val1 grad_x[v1b,:]+=grad_dgm[i,1]*(x[v1b,:]-x[v1a,:])/val1 return grad_x
Now let’s encapsulate the functions into Tensorflow functions (it’s just as simple for Pytorch) and define a loss function that is the negative of the distance from the points in the persistence diagram to its diagonal. This will force the diagram to have many points, where their y-coordinates are much larger than their x-coordinates. In this way, a point cloud will have many large holes.
import tensorflow as tffrom tensorflow.python.framework import opsdef py_func(func, inp, Tout, stateful=True, name=None, grad=None): rnd_name = “PyFuncGrad” + str(np.random.randint(0, 1e+8)) tf.RegisterGradient(rnd_name)(grad) g = tf.get_default_graph() with g.gradient_override_map({“PyFunc”: rnd_name}): return tf.py_func(func, inp, Tout, stateful=stateful, name=name)def Rips(card, hom_dim, x, Dx, max_length, name=None): with ops.op_scope([x], name, “Rips”) as name: return py_func(compute_rips, [x], [tf.float32], name=name, grad=_RipsGrad)def _RipsGrad(op, grad_dgm): pairs = op.outputs[1] x = op.inputs[0] grad_x = tf.py_func(compute_rips_grad, [grad_dgm,pairs,x], [tf.float32])[0] return [None, None, grad_x, None, None]
tf.reset_default_graph()x = tf.get_variable(“X”, shape=[n_pts,2], initializer=tf.random_uniform_initializer(0.,1.), trainable=True)dgm, pairs = Rips(x)loss = -tf.reduce_sum(tf.square(dgm[:,1]-dgm[:,0]))opt = tf.train.GradientDescentOptimizer(learning_rate=0.1)train = opt.minimize(loss)
Now we start optimizing! Here are the results for epochs 0, 20, and 90:
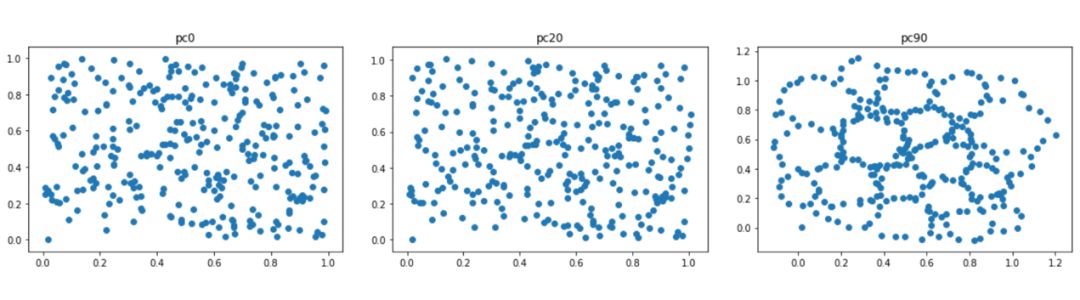
So many holes, so beautiful.Are we dreaming?If you want to look ahead, use other losses, check out this Gudhi tutorial.
https://github.com/GUDHI/TDA-tutorial/blob/master/Tuto-GUDHI-optimization.ipynb
This post is just a glimpse of the many possibilities offered by Gudhi, Scikit-Learn, and Tensorflow. I hope I can convince you that integrating TDA into your workflow has become very simple. Even though many TDA applications have already appeared in the literature, there are definitely more applications waiting to be discovered!
The Holy Trinity of Topological Machine Learning: Gudhi, Scikit-Learn and Tensorflow
https://towardsdatascience.com/the-holy-trinity-of-topological-machine-learning-gudhi-scikit-learn-and-tensorflow-pytorch-3cda2aa249b5
If you want to keep in touch and continue to receive updates related to the field of data science, including big data technologies, cutting-edge applications, lecture forums, and various event benefits, please scan the code to join the Data Party THU fan group, and we look forward to seeing you.
Translator’s Introduction
Sun Taochun, a senior at Capital Normal University, majoring in Remote Sensing Science and Technology. Currently focused on mastering and enhancing basic knowledge, hoping to explore the many possibilities of data science in geoscience applications in the future. One of my hobbies is translation and creation. In my spare time, I join the volunteer translation group of the THU Data Party platform, hoping to communicate and share with everyone and make progress together.
Translation Group Recruitment Information
Job Description: Requires a meticulous heart to translate selected foreign articles into fluent Chinese. If you are an overseas student in data science/statistics/computer science, or working abroad in related fields, or if you are confident in your language skills, you are welcome to join the translation group.
What you will gain: Regular translation training to improve volunteers’ translation skills, enhance awareness of cutting-edge data science, and overseas friends can stay connected with domestic technological application developments. The THU Data Party’s background in production, learning, and research provides good development opportunities for volunteers.
Other Benefits: Data scientists from well-known companies and students from prestigious universities such as Peking University, Tsinghua University, and overseas institutions will become your partners in the translation group.
Click the “Read the Original” at the end of the article to join the Data Party team~
Reprint Notice
For reprints, please indicate the author and source prominently at the beginning (reprinted from: Data Party ID: DatapiTHU), and place a prominent QR code of the Data Party at the end of the article. For articles with original labels, please send the 【Article Name – Pending Authorization Public Account Name and ID】 to the contact email to apply for whitelist authorization and edit according to requirements.
After publishing, please feedback the link to the contact email (see below). Unauthorized reprints and adaptations will be legally pursued.
Click “Read the Original” to embrace the organization.