Please click “Yueying Technology Brain Science“, “Brain Talk“, and choose to follow us.Yueying Technology focuses on online/offline training and data processing services in technologies such as EEG/ERP, fMRI, sMRI, DTI, fNIRS, and machine learning, hoping that our professional services can provide support and help to colleagues. In addition, we have establisheda WeChat group and QQ group for brain science literature service, where dedicated personnel help download literature for free, and colleagues are welcome to join. If you have any questions, please add WeChat ID15560177218 for consultation.
Introduction: The human brain network is organized in a hierarchical structure, exhibiting different connectivity gradients.The primary gradient is anchored by modality-specific main regions and cross-modal regions. Previous studies have suggested that the unimodal-cross-modal gradient of functional connectivity may provide an overall framework for higher-order cognition in the human brain. However, there is still a lack of direct evidence linking the two.
Objective: This study utilizes two independent datasets of young adults to explore the relationship between creativity and the unimodal-cross-modal gradient. Methods: For each individual, we identified the unimodal-cross-modal gradient of the functional connectivity and calculated its overall measurement. We then correlated individual creativity scores with the unimodal-cross-modal gradient indicators at whole-brain, subsystem, and regional levels.
Results: The creative performance of subjects was related to the gradient axis distance between primary brain regions and cross-modal brain regions, as well as the distance between the ventral attention network and the default network. Individual creativity was positively correlated with the gradient of the ventral attention network regions and negatively correlated with the gradient of the visual cortex regions.
Conclusion: The results of this study directly link the unimodal-cross-modal gradient with individual creativity, providing empirical evidence for the cognitive significance of functional connectivity gradients.
Exploring how the human brain processes information to develop cognition is a major goal of cognitive neuroscience. Histological and imaging studies have found that the microstructure of the human brain is organized hierarchically, which may support information processing from primary cortices involved in basic functions to cross-modal regions serving higher-order cognition. In recent years, based on resting-state functional magnetic resonance imaging (resting-state fMRI) technology and connectivity gradient analysis, researchers can explore the hierarchical structure of brain functional connectivity through multiple low-dimensional gradients.The main connectivity gradient in adults (i.e., unimodal-cross-modal) is determined by primary brain regions and cross-brain regions, which can capture the cognitive spectrum from direct perception and action to increasingly abstract cognitive functions. Additionally, atypical unimodal-cross-modal gradients are associated with cognitive and behavioral impairments in populations with mental disorders and LSD abuse. However, there is still a lack of direct evidence supporting specific individual cognition within the functional connectivity gradient.
Previous studies have suggested that unimodal-cross-modal gradients may provide a mechanism for higher-order cognitive functions in the human brain. Cross-modal regions located at the anchor points of the main gradient are known for their importance in various abstract and complex cognitions. The “tethering hypothesis” proposes that the functional attribution of cross-modal regions is related to their spatial distance from functionally specialized sensory and motor systems constrained by external stimulus input. Murphy et al. demonstrated that regions activated during memory judgment tasks were stronger than those activated during perceptual tasks, and these regions were farthest from the sensory/motor cortex on the functional gradient, which may imply that regions responsible for complex representations need to be isolated from direct input functions. Furthermore, cross-modal regions are located at the end of the cortical hierarchy, receiving multimodal sensory information from unimodal regions (such as somatosensory, visual, and auditory) and ultimately integrating it into understanding representations, which may explain their involvement in various cognitions. It is speculated that unimodal-cross-modal gradients can promote the formation of abstract thinking by separating immediate environmental inputs and can also promote the development of complex cognition by integrating multidimensional sensory information.
Individual creativity involves the manipulation of abstract representations and the integration of multiple features, providing a suitable window for studying the cognitive effects of unimodal-cross-modal gradients. Creativity is a typical higher-order cognitive ability in the human brain, requiring the formation of abstract concepts, loosening the focus on external stimuli, and indulging in internal thought. Previous studies have shown that individual creativity primarily relies on internal abstract thinking and is related to the functional organization and activation of DMN regions. Additionally, creativity is also a comprehensive ability that requires individuals to construct a stored knowledge system to generate novel and useful ideas and products. The human brain processes and integrates multimodal information and then transforms it into novel ideas or products through different cognitive processes. These processes have been shown to be related to the interaction between DMN regions and other regions, reflecting the functional coupling of the whole-brain framework rather than the specific functions of local regions. In summary, individual creativity may be closely related to the overall framework of the brain’s functional processing hierarchy, and connectivity gradient analysis may provide a comprehensive perspective for understanding the neural mechanisms of creativity.
This study aims to explore the relationship between unimodal-cross-modal gradients and individual differences in creativity. Combining previous research results, we propose two hypotheses: (i) the overall range of unimodal-cross-modal functional gradients is correlated with individual creativity scores; (ii) the gradient regions associated with creativity scores are mainly located in cross-modal areas. In this study, we used two large cohorts of cognitively normal young adults and applied diffusion map embedding methods to identify individual connectivity gradient. We then studied the association between individual creativity and unimodal-cross-modal gradients at the whole-brain, subsystem, and regional levels. We conducted several validation analyses to examine the robustness of our main results.
2. Methods
2.1 Participants
In this study, we used two independent datasets of young adults for discovery and validation analyses. The discovery dataset comes from the Southwest University Longitudinal Imaging Multimodal (SLIM) project, which includes 378 healthy subjects (173 males, age = 19.22±1.33 years), focusing on individual personality, creativity, and brain structural and functional characteristics. Additionally, the validation dataset from the Southwest University Gene-Brain-Behavior (GBB) project includes 553 healthy subjects (155 males, age = 19.27±1.56 years), which is an ongoing longitudinal cohort aimed at elucidating the genetic and neural basis of cognition and behavior.
2.2 Individual Creativity Assessment
To measure individual creativity, all participants in both datasets completed three divergent thinking tasks, including the Alternative Uses Task (AUT), Product Improvement Task (PIT), and Figural Creativity Task (FCT). Specifically, in the AUT task (2 items, 6 minutes), participants were asked to come up with as many novel and interesting uses for objects (such as bricks and cans) as possible. In the PIT task (1 item, 10 minutes), participants were asked to write down as many solutions as possible to improve a product (a toy elephant) to make it more enjoyable and appealing. The FCT task (10 items, 10 minutes) required participants to draw as many uncommon but meaningful sketches as possible based on incomplete figures and name what they completed. All three tasks were completed using paper and pencil. We recruited four independent raters and trained them to score participants’ responses according to a unified scoring manual. More detailed information can be found in our previous work. In each creativity task, participants’ responses were categorized into different creativity dimensions: fluency and originality.Fluency measures the number of meaningful and relevant responses per entry, while originality measures the novelty of each response. Given that the evaluation process was conducted by different raters in the SLIM and GBB datasets, here, we converted the scores of each dimension of each task into Z-scores within each dataset to control for systematic evaluation biases caused by raters or items. Finally, we took the weighted mean of the creativity dimensions from the three tasks as a representative indicator of creativity scores.
2.3 MRI Data Acquisition
All MRI scans were conducted at the Southwest University Brain Imaging Center using a 3T Siemens Trio MRI scanner (Siemens Medical Systems, Erlangen, Germany). During an 8-minute resting-state scan, participants were instructed to lie still on their backs and avoid falling asleep; they were asked to fixate on a central cross and not think about anything in particular. Foam pads were used to minimize head movement. A gradient echo planar imaging (GREEPI) sequence obtained a total of 242 resting-state functional images. High-resolution T1-weighted structural images were acquired using a magnetization-prepared rapid gradient echo (MPRAGE) sequence.
2.4 MRI Data Preprocessing
Resting-state neuroimaging data preprocessing was performed using the Statistical Parametric Mapping toolbox (SPM8, http://www.fil.ion.ucl.ac.uk/spm) and the Data Processing Assistant for Resting-State fMRI (DPARSF, http://www.restfmri.net/forum/DPARSF). The preprocessing procedure was consistent with our previous studies. The first 10 EPI volumes were discarded to suppress the equilibrium effect and allow the signal to reach a steady state. The remaining 232 images underwent multiple preprocessing steps. First, slice timing correction and head motion realignment were performed on the images, followed by normalization to the Montreal Neurological Institute standard space (resampled voxel size = 3 × 3 × 3 mm) and spatial smoothing using an 8 mm full-width at half-maximum Gaussian kernel. The smoothed data underwent linear detrending and were filtered using a band-pass temporal filter (0.01-0.1 Hz). Interference correction (i.e., signals from white matter and cerebrospinal fluid, global mean signal, and six rigid head motion parameters) was applied to eliminate potential effects of physiological artifacts. Data quality control was carefully conducted. Specifically, participants with poor fMRI image data or incomplete demographic information were excluded from the study; participants who exceeded 3 mm of maximum motion between volumes in any direction and those with rotations greater than 3° around each axis were also excluded from the analysis.
2.5 Connectivity Gradient Analysis
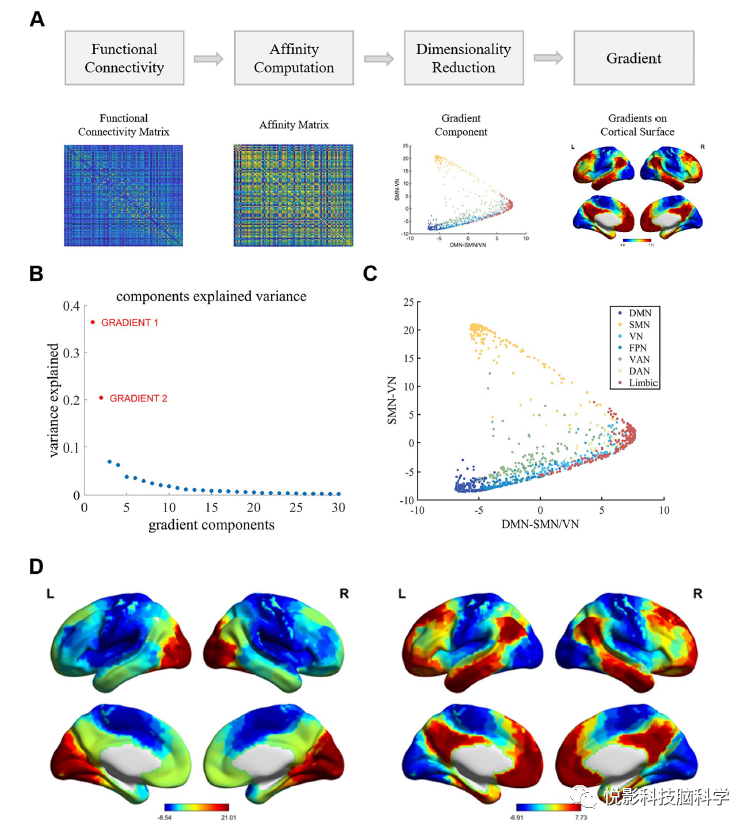
Connectivity gradient analysis uses nonlinear dimensionality reduction methods to identify several low-dimensional gradients to characterize the spatial distribution of high-dimensional functional connectivity (FC) matrices. This method measures the similarity of FC profiles for each pair of nodes, where nodes that are similar in FC are close together in the functional gradient, while different nodes are far apart in the functional gradient. Specifically, for each participant, we first constructed the FC matrix by calculating the Pearson correlation between the time series of each pair of nodes (1000 brain regions pre-defined). The partitioned regions spanned the cortical, subcortical structures, and cerebellum, corresponding to the seven functional systems assigned by Yeo. For each individual, we obtained an FC matrix (with 1000 × 1000 entries), and then averaged all individual FC matrices to obtain a group-level FC matrix. Following previous studies, both group-level and individual FC matrices were z-transformed and thresholded by retaining the top 10% of weighted connections for each row. We then calculated the cosine similarity between each pair of thresholded connectivity maps to obtain the cosine similarity matrix. Finally, we applied diffusion map embedding, a nonlinear dimensionality reduction algorithm, to the cosine similarity matrix to identify group-level and individual connectivity gradient components. In a given gradient axis, cortical regions with many connections or very strong connections are closer together, while regions with few or no connections are farther apart. Compared to other nonlinear dimensionality reduction techniques, the diffusion mapping algorithm is relatively robust to noise and ensures stable representations of connectivity. A conceptual diagram of the functional connectivity gradient method is shown in Figure 1a.
To ensure comparability of gradient axes between individuals, we used Procrustes rotation methods to align the individual original gradient axes with a group-based iterative gradient template. Specifically, we first aligned the gradient axes of all individual scans with the gradient distribution pattern of a randomly selected subject in the dataset. We then averaged the aligned gradient axes to obtain a group average gradient template, which was then aligned with the original gradient axes. This process was repeated 100 times. Finally, we sorted the identified gradients in the gradient template in descending order based on the average connection variance of the functional connectivity gradient.
2.6 Associations between Functional Connectivity Gradients and Individual Creativity
First, to examine the relationship between unimodal-cross-modal gradients and individual creativity at the whole-brain level, we first calculated the overall measurements of the gradients (including range, explained variance, and spatial variation) with individual divergent thinking task scores, controlling for gender, age, and head motion parameters (mean FD).
Second, controlling for gender, age, and mean FD, we calculated the global measures of the gradients (range and spatial variation) of each subsystem and their Pearson correlations with individual creativity to derive the relationship between unimodal-cross-modal gradients and individual creativity.
Third, we used Pearson correlation analysis to examine the associations between unimodal-cross-modal gradients and individual creativity at the regional level, controlling for gender, age, and mean FD.
To further clarify the relationship between unimodal-cross-modal gradients and creativity, we divided participants into high and low creativity subgroups based on creativity scores. Specifically, the top 27% of creativity scores were classified as the high creativity subgroup, while the bottom 27% were classified as the low creativity subgroup. We conducted independent two-sample t-tests to compare the unimodal-cross-modal gradients at the whole-brain, subsystem, and regional levels between the two subgroups.
2.7 Meta-analysis based on Neurosynth
At the regional level, multiple regions’ unimodal-cross-modal gradients were found to be associated with individual creativity. Furthermore, to elucidate the potential cognitive significance of these specific creativity-related brain regions, we conducted a meta-analysis based on the Neurosynth dataset, comparing the empirical statistical maps (corrected t-values) and task activation maps in the Neurosynth database to identify cognitive items related to creativity-associated brain regions.
2.8 Validation Analysis
To validate the robustness of the results from the SLIM dataset, we used an independent replication dataset, the GBB dataset, to conduct the same analysis. Specific information can be found in the supplementary materials.
3. Results
3.1 Association between Individual Creativity and Whole-Brain Unimodal-Cross-Modal Gradients
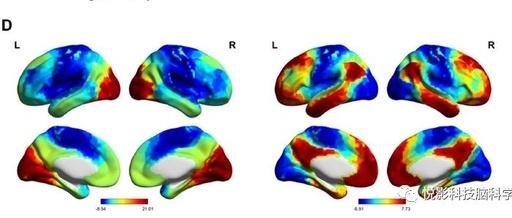
The scores of individual creativity tasks ranged from −1.63 to 2.34 (mean = 0.01±0.72). Based on creativity scores, the subjects were divided into high creativity and low creativity groups. Descriptive statistics of creativity scores for both subgroups are shown in Table 1. The group-level first two gradients of the average functional connectivity group are shown in Figure 1b-d. The main gradient accounts for 36.5% of the variance in the connectivity group (Figure 1b), with SMN and VN serving as the two anchor points of the axis (Figure 1c), reflecting a sensory-motor-visual pattern (Figure 1d, left). The second gradient explains 20.4% of the variance in the connectivity group (Figure 1b), distinguishing DMN from SMN/VN (Figure 1c), which is similar to the unimodal-cross-modal gradients reported in previous studies (Figure 1d, right). We first examined the relationship between unimodal-cross-modal gradients and individual creativity scores. Unfortunately, we found no significant association between the overall measurement of unimodal-cross-modal gradients and individual creativity scores (Supplementary Figure 1). Additionally, considering previous reports on unimodal-cross-modal changes in adult lifespan samples, we also investigated age-related changes in unimodal-cross-modal gradients. We found that age-related increases in unimodal-cross-modal gradient scores mainly occurred in the visual network (Supplementary Figure 2), which is highly consistent with previous findings. We then compared the overall indicators between high creativity and low creativity subgroups; the results indicated no significant differences between the groups in the overall measurements of the gradient.
3.2 Association between Individual Creativity and Unimodal-Cross-Modal Gradients at the Subsystem Level
The group-level unimodal-cross-modal gradient scores of seven subsystems are shown in Figure 2a. For each participant, we calculated the gradient values and global topographical measures (i.e., range and spatial variation) of each subsystem and examined their relationships with individual creativity scores. The results indicated that the gradient values of VAN were positively correlated with creativity (r = 0.15, P <0.01, Figure 2b, left), while significantly negatively correlated with creativity scores in VN (r = -0.18, P <0.01, Figure 2b, right). Additionally, we further examined the gradient scores of each node within VAN and VN, finding that 47 nodes within VAN were positively correlated with individual creativity (Pmax = 0.02, FDR-corrected P<0.05, see supplementary Table 1 for specific node information). Furthermore, the gradient range (r =−0.11,P<0.05, Figure 2c left) and spatial variation (r =−0.11,P<0.05, Figure 2d, left) of SMN were negatively correlated with creativity scores, while the gradient range of VN was positively correlated with creativity scores (r = 0.10, P<0.05, Figure 2c, right). The spatial variability of VAN was negatively correlated with creativity scores (r =−0.13,P<0.05, Figure 2d, right). Additionally, the relative distances of subsystem-level gradients between subgroups were also displayed (Figure 2e and f). Group comparisons showed that VAN tended to associate with the cortex, while VN gradually moved away from cross-modal regions with increasing creativity (Figure 2e).
To better visualize the differences in subsystem gradient scores between high creativity and low creativity subgroups, we established a coordinate system where unimodal-cross-modal scores were represented on the x-axis, and sensory-motor-visual gradient scores were represented on the y-axis (Figure 2f). The scatter plot shows that as creativity increases, VAN tends to move towards the associative cortex, while VN gradually moves away from cross-modal brain regions.
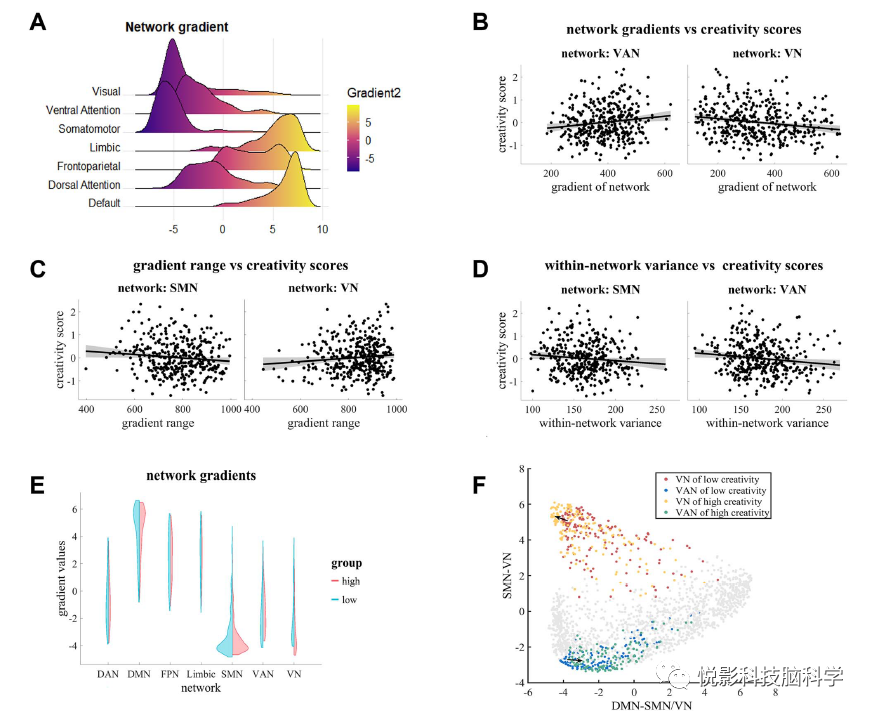
Figure 2 a) Unimodal-cross-modal gradients of seven subsystems. b) Scatter plot showing the correlation between network gradients and creativity. c) The relationship of network gradients with creativity ranges. d) The correlation of gradient changes within networks with creativity. e) The gradient patterns of high creativity and low creativity subgroups within the network.
Next, we examined whether the relative distances between subsystems were associated with individual creativity scores. The results indicated that the distance between DMN and VAN (DMN-VAN, r =−0.12,P<0.05, Figure 3), as well as the distance between FPN and VAN (FPN-VAN, r =−0.12,P<0.05, Figure 3) were negatively correlated with creativity scores. The distance between DMN and VN (DMN-VN, r = 0.19, P <0.01, Figure 3), between FPN and VN (FPN-VN, r = 0.17, P<0.01, Figure 3), and between higher-order systems and lower-order systems (DMN + FPN + Limbic-VN-SMN, r = 0.16, P<0.01) were significantly positively correlated with creativity task performance. The correlations between the gradient distances among subsystems and creativity scores are shown in Figure 3.
In summary, these findings suggest that individual creativity is primarily related to the relative positions of VAN and VN on the unimodal-cross-modal gradient axis, indicating that the greater the individual creativity, the higher the degree of separation between primary brain regions and cross-modal brain regions.
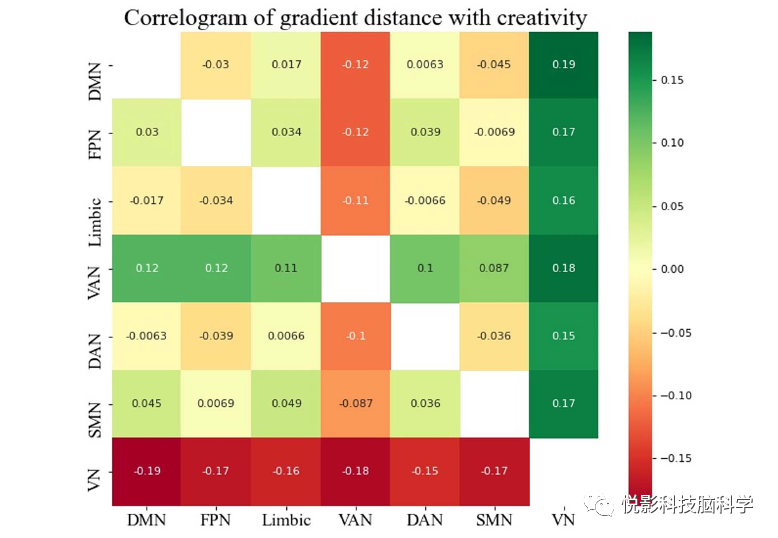
Figure 3 Correlation diagram of gradient distances between creative pairs of subsystems
3.3 Relationship between Individual Creativity and Regional Unimodal-Cross-Modal Gradients
We then assessed the correlation between individual creativity and regional gradient scores of unimodal-cross-modal regions, controlling for gender, age, and head motion parameters. We observed that creativity scores were significantly positively correlated with the regional gradient levels of the visual attention network, while significantly negatively correlated with the gradient levels of the visual cortex (Figure 4a). Additionally, we compared the regional gradient scores of group-level unimodal-cross-modal gradients between high creativity and low creativity subgroups (Figure 4b). However, at the regional level, there were no statistically significant group differences after FDR correction.

Figure 4 Regions significantly associated with unimodal-cross-modal gradients
To further understand the cognitive functions of the regions associated with creativity, we conducted a meta-analysis using Neurosynth to identify cognitive items related to the statistical r-map (Figure 4a). We first divided the associated regions into positive value maps and negative value maps (Figure 5a). We then used Pearson correlation analysis to examine the spatial correlations between the two empirical maps and task activation maps in the Neurosynth dataset. Finally, we utilized the two empirical maps to obtain lower-order assistive items based on the correlation coefficients. For positive maps, these brain regions were significantly positively correlated with cognitive functions related to SMN, such as execution, motion, and motor imagery (Figure 5b, top). For negative maps, these brain regions significantly participated in visual-related functions (Figure 5b, bottom).
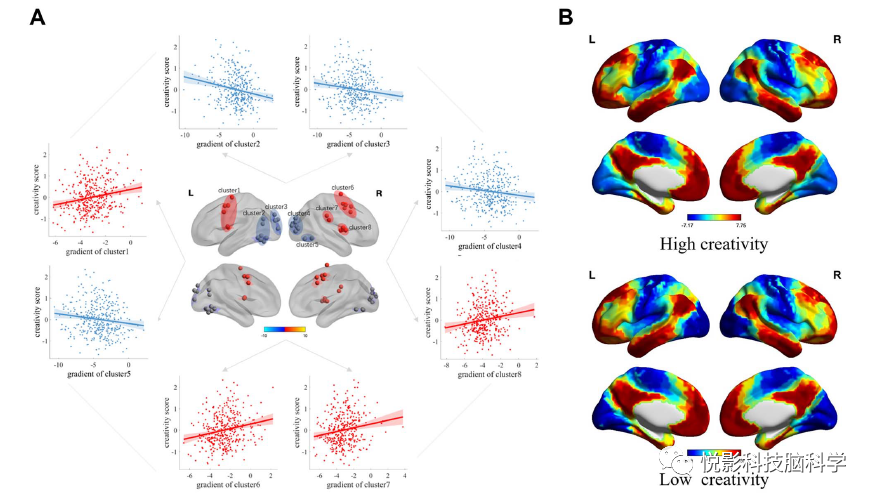
Figure 5 Cognitive decoding maps of significant cognitive functions estimated using Neurosynth
3.4 Validation Analysis
To validate the robustness of the main results from the exploratory dataset, we conducted the same analysis in the replication dataset. First, the unimodal-cross-modal gradients in the replication dataset exhibited similar patterns, with primary regions at one end and cross-modal regions at the other end, explaining 20.4% of the variance in the whole-brain functional connectivity group (Supplementary Figure 3). The arrangement of subsystems on the unimodal-cross-modal gradient axis also resembled the distribution in the exploratory dataset (Supplementary Figure 4). Notably, consistent with the main results in the exploratory dataset, better performance in creativity tasks was associated with the separation of lower-order sensory systems and higher-order associative cortices (DMN-VN, r = 0.18, P <0.01; FPN-VN, r = 0.14, P<0.01; DMN + FPN + Limbic-VN-SMN, r = 0.10, P<0.05). In summary, the association between unimodal-cross-modal gradients and creativity remains highly consistent with the main results.
4. Discussion
This study evaluated the association between unimodal-cross-modal connectivity gradients and individual creativity. Specifically, better creativity scores were associated with a smaller distance between VAN and higher-order subsystems on the gradient axis, as well as increased separation between the visual cortex and cross-modal regions (i.e., DMN, FPN, and limbic systems). Furthermore, the regions related to creativity involved execution, movement, and visual functions. The results of this study may suggest that creativity requires the collaboration of associative cortices with VAN and the distance from primary functional connectivity regions. These findings directly link the unimodal-cross-modal gradients of the human brain with higher-order cognition and provide new perspectives for understanding the formation of creativity.
The human brain is often bombarded by external and internal information. Fortunately, VAN can guide attention to preferred stimuli from either external or internal sources, determining which information can be captured by attention. Previous studies have indicated that VAN, as a salient network, primarily participates in the allocation of attentional resources, bridging primary subsystems and higher-order subsystems in information processing. Notably, VAN also plays an important role in the formation of creativity. Specifically, Beaty et al. identified a brain network associated with divergent thinking, including the dorsal anterior cingulate cortex and anterior insula (part of VAN), and proposed that the coupling between DMN and VAN increases at the onset of divergent thinking tasks. Furthermore, the coupling between DMN and VAN can predict performance on divergent thinking tasks in both young and elderly individuals. Activation of the anterior insula, a significant stage in the creative generation process, has also been reported, further suggesting the significance of VAN in creativity.
The current study found that individual creativity is correlated with the gradient values of VAN, the distance between VAN and higher-order subsystems (i.e., DMN and FPN), and the gradient scores of regions within VAN. These results indicate that functional integration between VAN and higher-order subsystems is associated with better creative thinking. Combined with previous research, we speculate that the proximity of VAN to DMN and FPN along the unimodal-cross-modal gradient may be due to stronger functional coupling between VAN and higher-order subsystems, which also supports individual creativity.
In this study, individuals who performed better in creative tasks exhibited greater separation between VN and DMN, FPN along the unimodal-cross-modal gradient axis. Given that the distance along the gradient axis is determined by the connectivity profiles of brain regions, high creativity individuals showed significant differences in the connection patterns between primary cortices and cross-modal brain regions. These findings are highly consistent with the “tethering hypothesis,” which suggests that cross-modal associative cortices gain information integration and abstract functional properties from increasing spatial separation from primary cortices constrained by external inputs. In the hierarchy of information processing, the visual cortex is at the bottom, receiving immediate environmental inputs, processing raw visual signals, and transferring specialized representations to unimodal regions.
In contrast, cross-modal regions (including DMN, FPN, and limbic systems) are positioned at the top of the processing flow, enabling the integration of multidimensional signals and the formation of comprehensive and abstract representations. According to the “tethering” hypothesis, the distance along the unimodal-cross-modal gradient axis may protect cross-modal brain regions from direct external input interference, facilitating the formation of abstract cognitive functions.
It is worth noting that creative thinking requires ignoring direct environmental input interference and forming highly abstract conceptual representations. Previous studies have also indicated that better performance in creativity tasks is associated with reduced FC between DMN and primary sensory systems (i.e., sensory/motor, auditory, and visual), where individuals with high creativity can better suppress salient task-related stimuli in creative tasks and shift towards more self-generated information. Therefore, the functional separation between unimodal and cross-modal regions along the gradient axis may lead to cross-modal regions being less disturbed by external inputs, participating more in internal thought and cognitive processing, which is crucial for individual creativity.
In this study, we also observed that the spatial variation of unimodal-cross-modal gradients of SMN and VAN was negatively correlated with individual creativity. In the group-level unimodal-cross-modal gradients, both SMN and VAN were located at the lower end of the gradient axis, involved in sensory/motor and attentional processes. The increased homogeneity of SMN and VAN may reflect better local specialized processing in individuals with high creativity.
EEG Training Class
MRI Training Class
fNIRS Training Class
EEG/MRI/fNIRS Data Processing
Top Journal New Method Replication Service — Edge Central Brain Network Model
Top Journal New Method Replication Service — Brain Temporal Scale Gradient
Impact Factor 10+ | Yueying Technology helps clients publish high-level SCI papers 5
Equipment Sales/Rental
Smarting: The First Truly Portable and Mobile EEG Device
MRI and EEG Equipment Sharing Services