To identify the monotonicity of a function based on the graph of its derivative, we need to understand the relationship between the derivative and the function’s monotonicity. The derivative describes the instantaneous rate of change of the function at a given point. If the derivative is positive, the function is increasing at that point; if the derivative is negative, the function is decreasing at that point; if the derivative is zero, the function may have a local extremum or an inflection point at that point.
The specific steps are as follows:
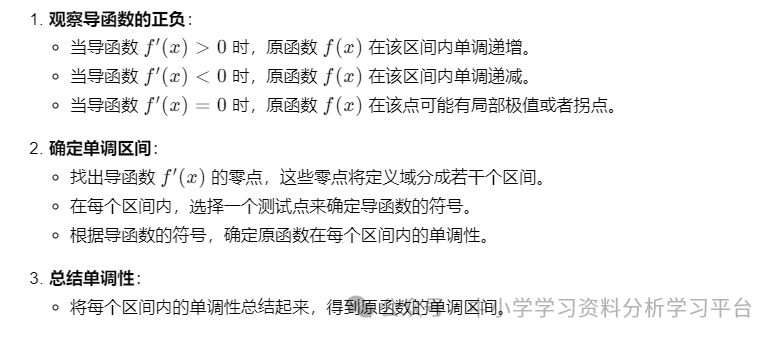
1. Observe the Value of the Derivative:
-
The sign of the derivative f ′ ( x ) f ( x ) -
When f ′ ( x ) > 0 f ( x ) -
When f ′ ( x ) < 0 f ( x ) -
When f ′ ( x ) = 0
2. Identify the Zeros of the Derivative:
-
The zeros of the derivative are the stationary points of the original function (i.e., possible extremum points or flat points). -
Find the intersections of the derivative graph with the x f ′ ( x ) = 0 -
At these zeros, the original function may change from increasing to decreasing or from decreasing to increasing.
3. Analyze the Sign Changes of the Derivative:
-
On either side of each zero of the derivative, check the sign of f ′ ( x ) -
If f ′ ( x ) -
If f ′ ( x ) -
If f ′ ( x )
4. Combine Derivative Graphs to Analyze Monotonicity:
-
Based on the positive and negative regions of the derivative graph, divide the x -
If the sign of the derivative is consistent within each interval, then the original function is monotonic in that interval: f ′ ( x ) > 0
f'(x) > 0f′(x)>0 : The original function is increasing. f ′ ( x ) < 0
f'(x) < 0f′(x)<0 : The original function is decreasing.
Example Analysis:
Assume the graph of the derivative f ′ ( x )
-
On the interval ( − ∞ , − 2 )
\infty, -2)(−∞,−2),f ′ ( x ) > 0 -
On the interval ( − 2 , 1 ) f ′ ( x ) < 0 -
On the interval ( 1 , ∞ )
\infty)(1,∞),f ′ ( x ) > 0
Conclusion:
f ( x )
f(x)f(x) has a maximum value at x = − 2 x = 1 -
The monotonicity is as follows: ( − ∞ , − 2 ) : f ( x )
(-
\infty, -2): f(x)(−∞,−2):f(x)is increasing; ( − 2 , 1 ) : f ( x )
(-2, 1): f(x)(−2,1):f(x) is decreasing; ( 1 , ∞ ) : f ( x )
(1,
\infty): f(x)(1,∞):f(x)is increasing.