This issue uses cursor to solve the problems encountered in learning basic skills in bioinformatics. Cursor is a code editor based on ChatGPT4, which can significantly shorten the learning cycle if used correctly.
The following records the problem-solving process, and the code included in the article is from Chapter 3 of ‘Practical R Programming’.
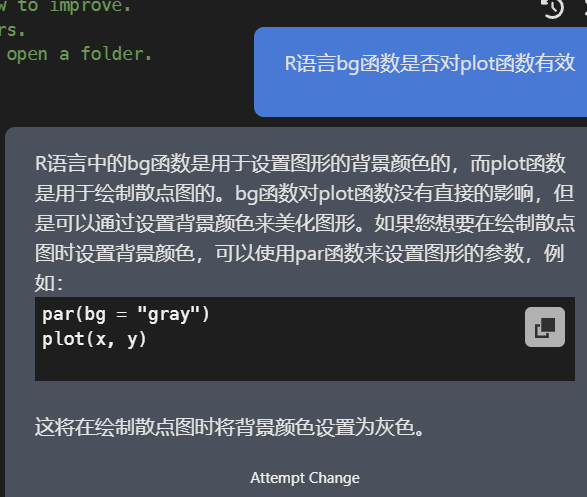
Problem 1: Background Color Fails to Display When Plotting
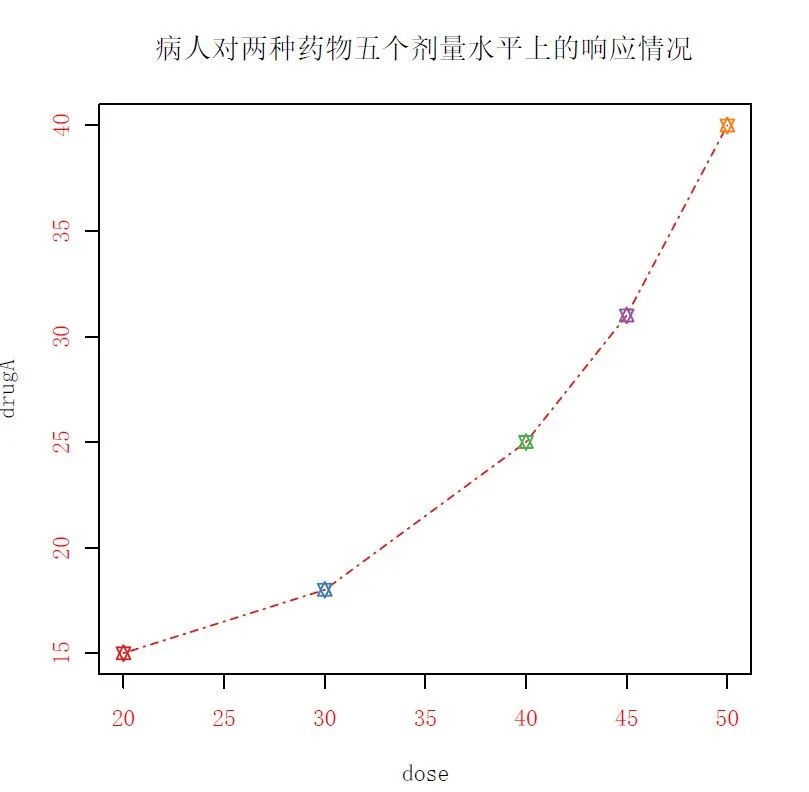
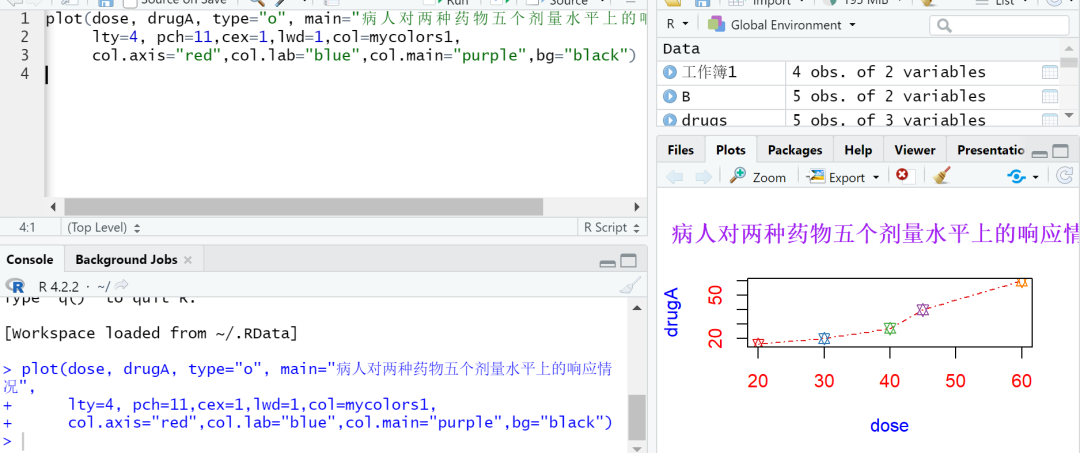
install.packages("RColorBrewer")library(RColorBrewer)n <- 7mycolors1 <- brewer.pal(n, "Set1")barplot(rep(1,n), col=mycolors) # Bar plotplot(dose, drugA, type="o", main="Patient Response to Two Drugs at Five Dosage Levels",lty=4,pch=11,cex=1,lwd=1,col=mycolors1,col.axis="red",col.lab="blue",col.main="purple",bg="black")• The output cannot display the black background.
Solution
• Use the par() function directly to output the black background; the par() function is effective for all graphics in the code.
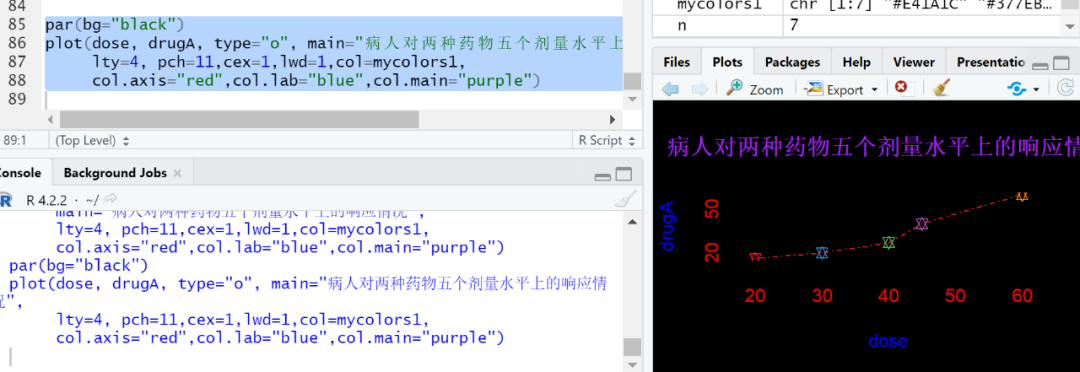
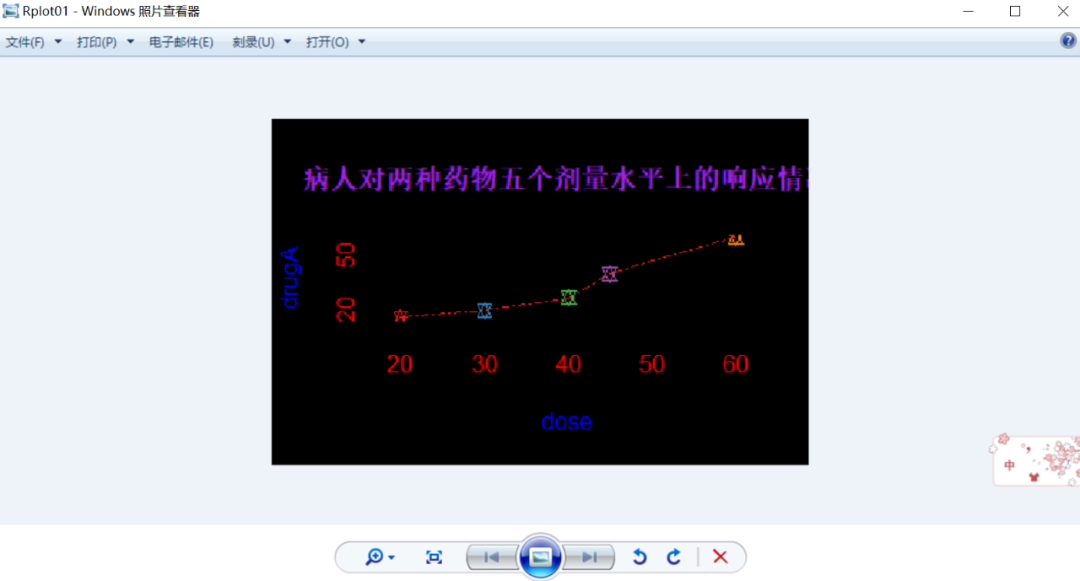
par(bg="black")plot(dose, drugA, type="o", main="Patient Response to Two Drugs at Five Dosage Levels", lty=4, pch=11,cex=1,lwd=1,col=mycolors1,col.axis="red",col.lab="blue",col.main="purple")• The output is as follows:
Extended Problem
1. When opening a new page, the background color does not display.
dev.new() # Open new pageplot(dose, drugA, type="o", main="Patient Response to Two Drugs at Five Dosage Levels", lty=4, pch=11,cex=1,lwd=1, col=mycolors1,col.axis="red", col.lab="blue",col.main="purple",bg="black")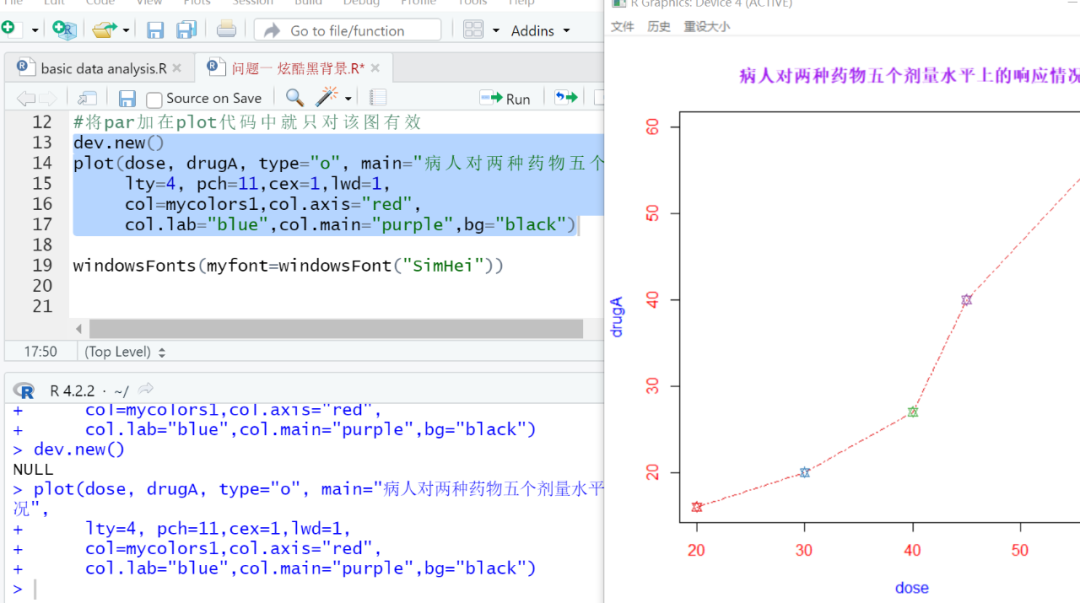
• Reason: The bg parameter is ineffective for the plot function; the black background of the plot display area might be due to the previous setting of the background to black via par, which is consistent with the response received.
Supplementary Solution
• The background color problem can be solved using ggplot2, but other parameters need further adjustments.
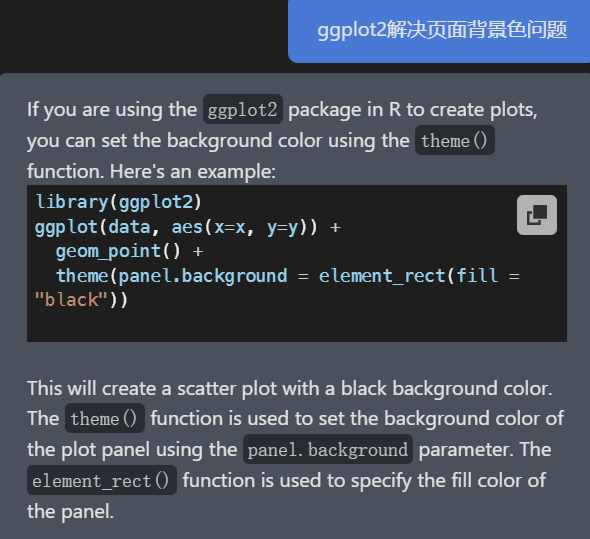
• Here is the code to modify the image color rather than the background color; the code and corresponding output for modifying the background color are as follows (black is not obvious, changed to blue).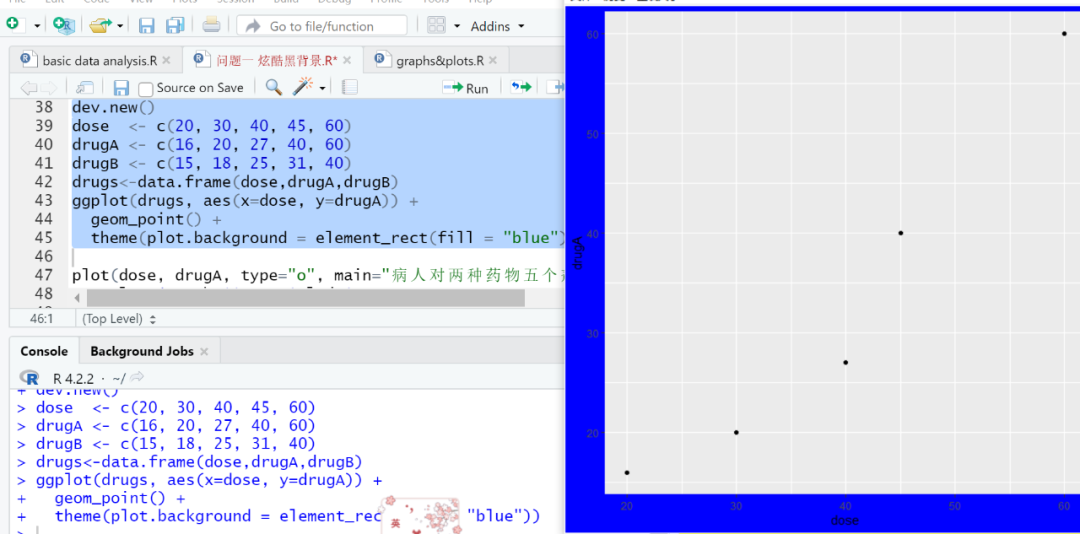
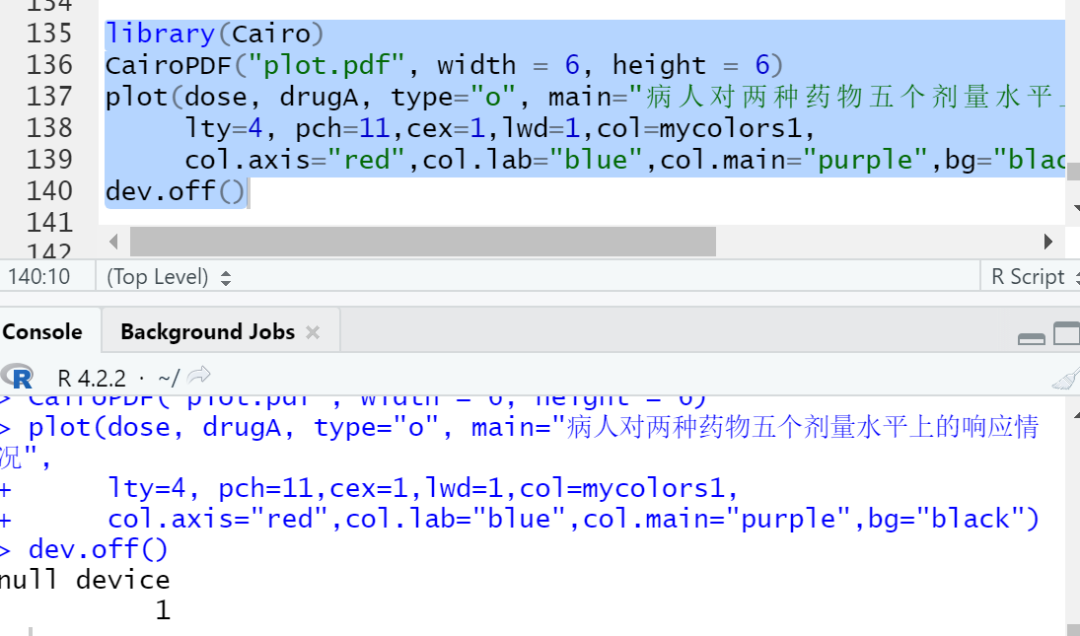
Problem 2: Garbled Text When Saving as PDF
• The code is the same as Problem 1, the result is as follows:
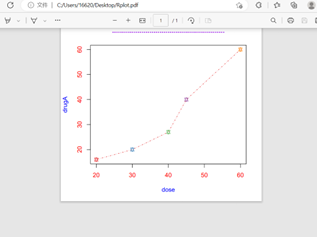
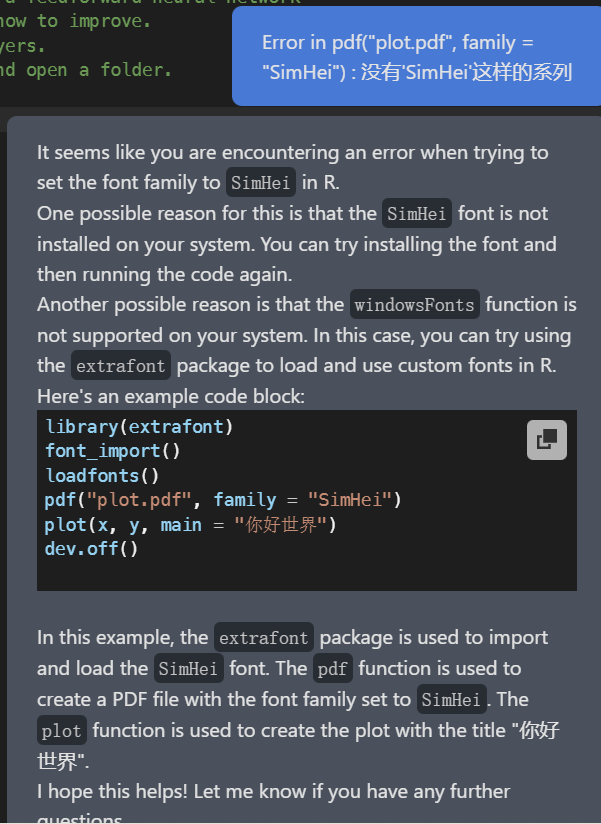
• After inquiry, the result indicated that the title font was not installed.
Solution
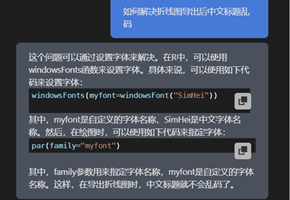
Idea 1: Solve the Font Issue and Save as PDF
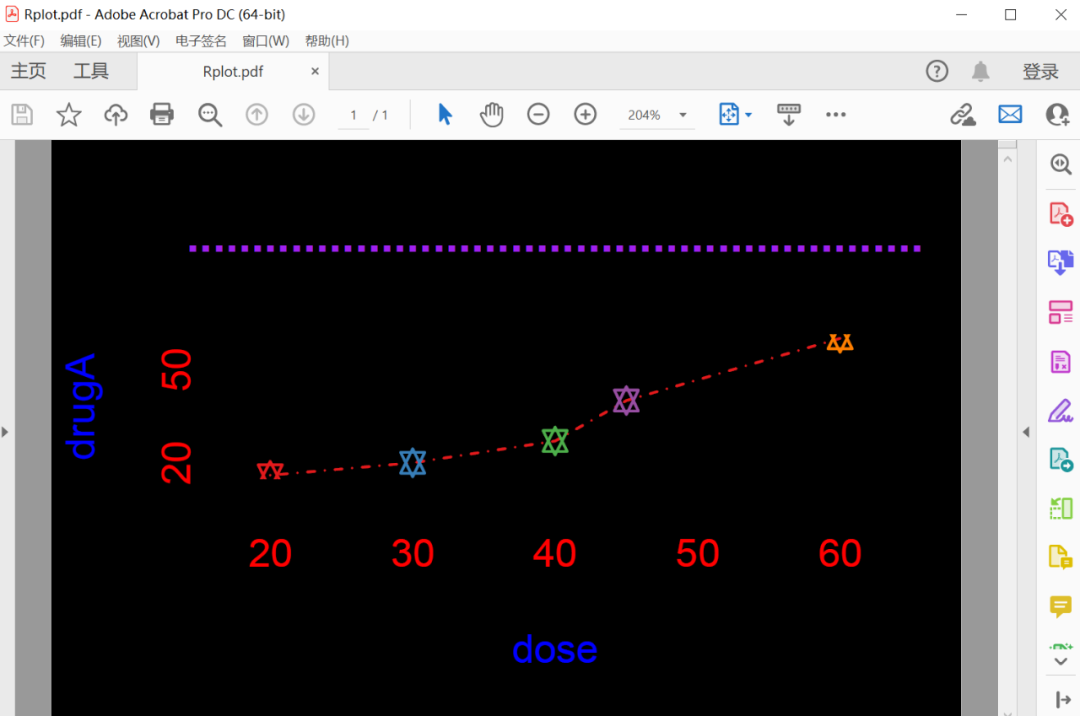
• Install the font and save as PDF; images in RStudio are improved but the PDF still has issues.
windowsFonts(myfont=windowsFont("SimHei"))plot(dose, drugA, type="o", main="Patient Response to Two Drugs at Five Dosage Levels",lty=4, pch=11,cex=1,lwd=1, col=mycolors1,col.axis="red",col.lab="blue",col.main="purple")par(bg="black")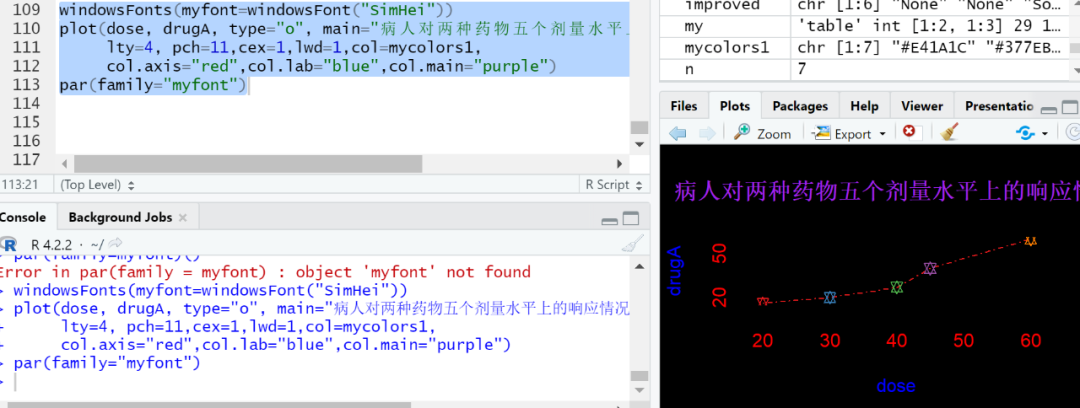
• Continue to inquire.
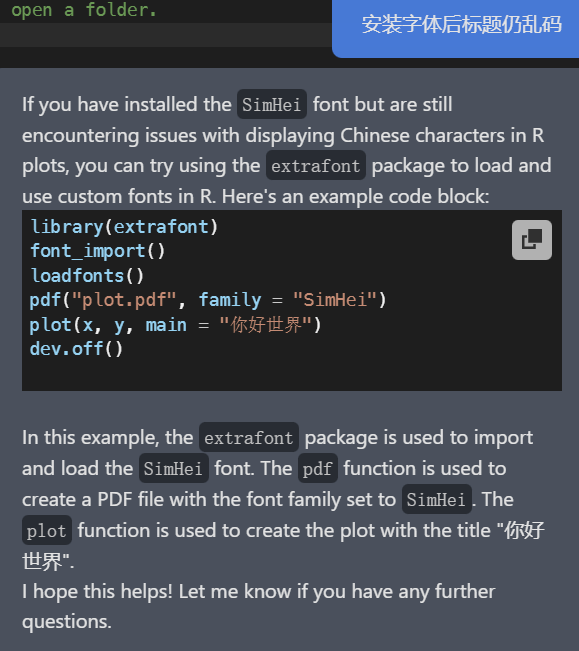
• Tried the extrafont package, but an error occurred.

• Inquired directly about the error message and received the same answer, giving up on that idea.
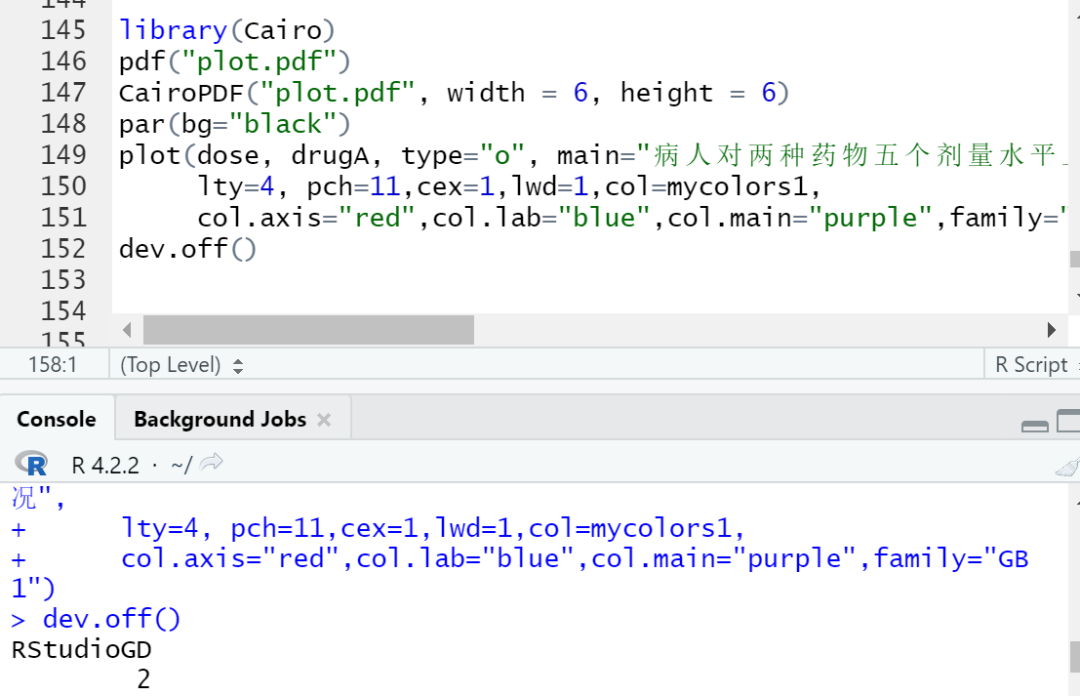
Idea 2: Change the Code for Outputting to PDF to Ensure the Font Displays Correctly
• The following code is provided by cursor, suggesting the use of the Cairo package to save.
library(Cairo)CairoPDF("plot.png", width = 6, height = 6, dpi = 300, type = "cairo")plot(x, y, main = "Hello World")dev.off()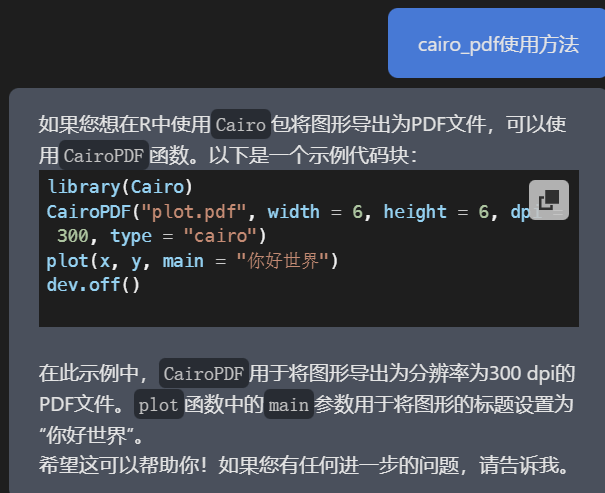
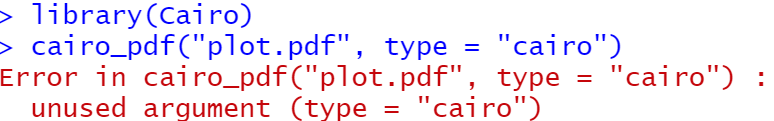
• After trying, an error occurred; continued to inquire about the error message.
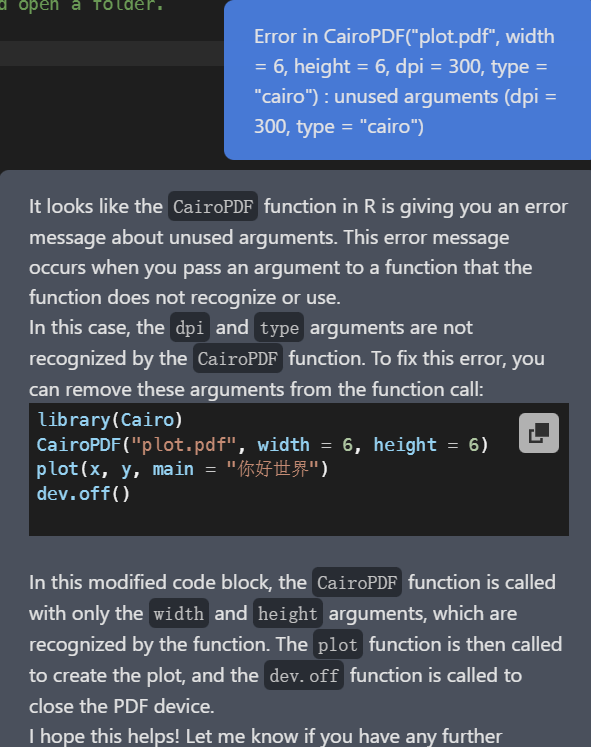
• The suggestion was to delete the statement directly, but the operation was still unsuccessful.
• Finally, adding the family parameter in the plot() function resolved the issue.
Idea 3: Install the Font and Export as Image
• The result is fine.
Supplement from Senior Sister
Problem 1:
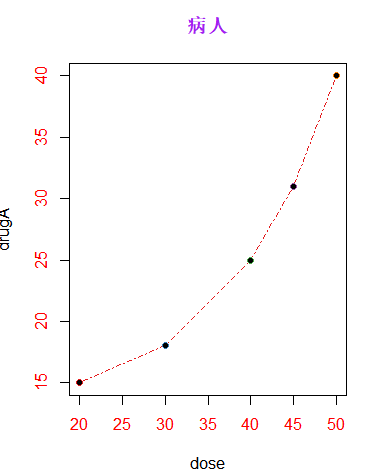
This is actually a noteworthy question. If we just use plot(), we will find that when plotting a scatter plot, the bg parameter in the plot function behaves like in the points function, which is different from the par function, as shown in the figure:
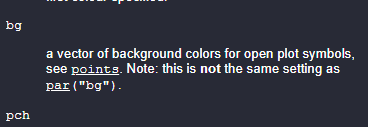
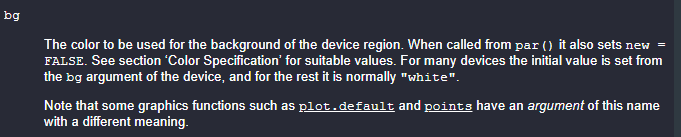
The bg parameter in the points function is explained as follows:

While the bg parameter in the par function is explained as follows:
The pch in this code is 11; if adjusted to 21 (i.e., circle), and bg=”black” is used, it will be found that those points are filled with black (the sketch is attached below).
In summary, different functions have different parameters. Although many have been encountered after becoming familiar, it is difficult to remember all of them. When learning new R packages, one may encounter parameters that have never been seen before. At this time, don’t forget to check the help and patiently read these English comments; it might be very helpful and provide some insights.
Although the cursor has powerful functionality, it may first require us to accurately pose questions. Through the attempts of Sister Guo, we also see that its ability to interpret code is strong and it can provide many ideas, but it may not precisely solve problems.
I think perhaps next time when we use it, we should first explore manually, and then break down the most critical step to ask, which might maximize the utilization of this AI’s functionality.
Problem 2:
It can be seen that Sister Guo is very serious in trying to solve the problem. The response provided by the cursor indeed offers some ideas, but it may not be completely relied upon.
In fact, the appearance of these dots is mainly because when saving as PDF, the Chinese font will appear garbled.
If the title is changed to English, this problem will not occur; generally, the graphs we make are basically in English. However, if you want to save with a Chinese title, consider installing the Cairo package and using the CairoPDF() function to save, and define a Chinese font in the plot function, for example, “GB1” is Songti, which can then be saved.
As the senior brother said, discovering problems and solving them is a skill, and learning based on problems is very important.
Sometimes learning a dozen lines of code is easy, but a single error can take double the time to solve. However, solving errors greatly trains our ability to pose questions, search for answers, and so on.
As the saying goes, “No pain, no gain”; in fact, when dealing with errors, it is precisely the process of cultivating our tacit understanding with the R language.
I wish the juniors enjoy the process of solving errors (dog head).
Below is the method to solve the garbled Chinese font issue when saving as PDF:
library(Cairo) CairoPDF("myplot1.pdf") # Restart with a new PDF file namemyplot <- plot(dose,drugA,type="o",main = "Patient Response to Two Drugs at Five Dosage Levels", family="GB1", # Songti lty = 4, pch = 11, cex= 1, lwd= 1,col=mycolors1, col.axis="red",col.lab = "black",col.main = "black",bg = "black")dev.off()