Click on the above“Beginner’s Visual Learning”, choose to add Star or Pin.
Essential content delivered to you first-hand.
Basic Knowledge
The Graph Convolutional Network (GCN) is a type of generalized neural network structure based on graph structures that has gained widespread attention and research from scholars in recent years due to its unique computational capabilities. Traditional deep learning models such as LSTM and CNN have achieved good results on Euclidean space data (language, images, videos, etc.), but they have certain limitations when it comes to processing non-Euclidean space data (e.g., social networks, information networks, etc.).
To address this issue, researchers have introduced the abstract concept of graphs from graph theory to represent non-Euclidean structured data. They utilize graph convolutional networks to process graph data in order to deeply explore its features and patterns.
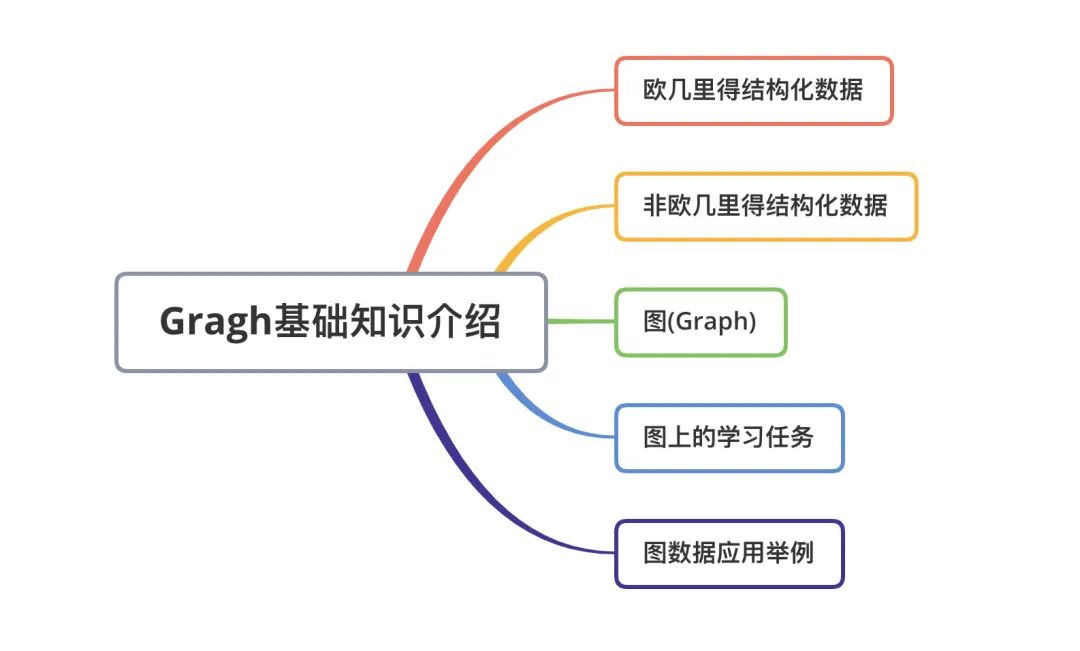
This article first introduces the characteristics of Euclidean structured data and non-Euclidean structured data; then, it introduces the concept of graphs from graph theory to address the representation problem of non-Euclidean structured data, and discusses some forms of representation of graphs; finally, it provides a simple example to illustrate the application of graph data, helping readers deepen their understanding of graphs.
Euclidean Structured Data
1. Euclidean Space
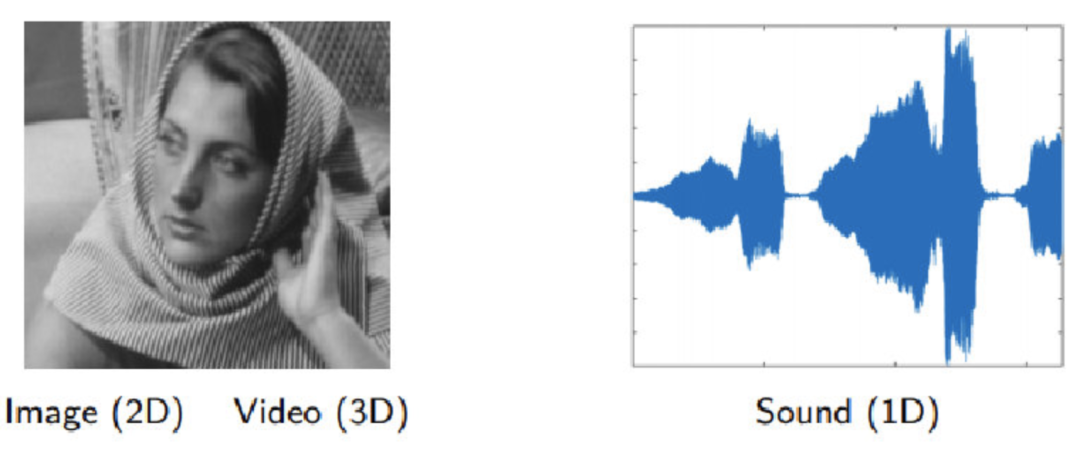
Euclidean space, abbreviated as Euclidean space (also referred to as flat space), is a generalization of the 2D and 3D spaces studied by Euclid in mathematics. This generalization transforms Euclid’s concepts of distance, length, and angles into a coordinate system of any number of dimensions. As shown in the figure below.
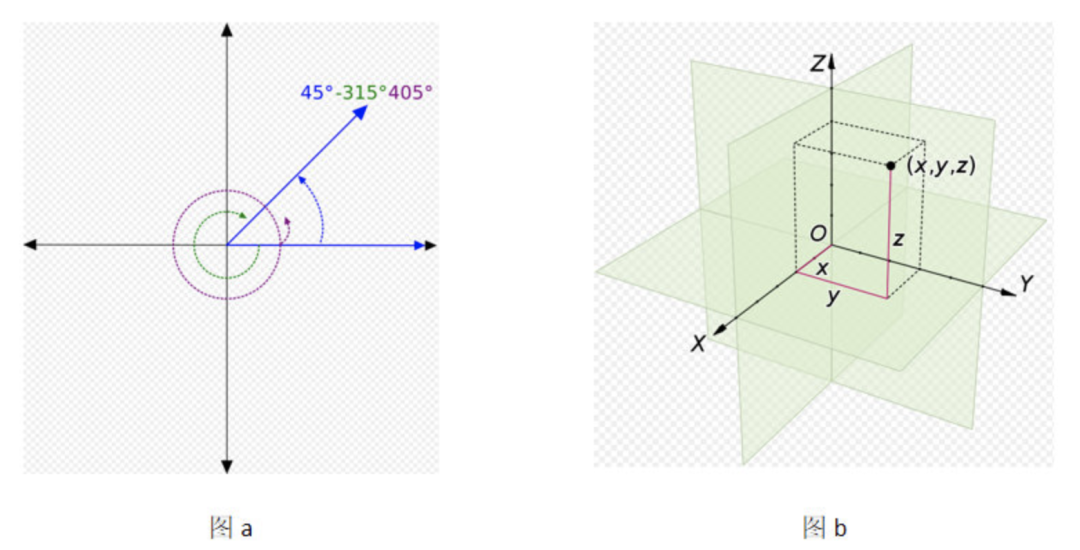
Figure a represents 2D Euclidean space, while figure b represents 3D Euclidean space.
2. Common Euclidean Structured Data
Data transformed into Euclidean space is referred to as Euclidean structured data.
Common types of Euclidean structured data include:
- 1D: Sound, time series, etc.;
- 2D: Images, etc.;
- 3D: Videos, hyperspectral images, etc.;
Non-Euclidean Structured Data
1. Non-Euclidean Space
However, not all data in scientific research can be transformed into Euclidean space (e.g., social networks, information networks, etc.). Data that cannot be structured in Euclidean space is referred to as non-Euclidean structured data.
2. Common Non-Euclidean Structured Data
Common types of non-Euclidean structured data include:
- 1D: Social networks (e.g., Facebook, Twitter, etc.);
- 2D: Biological networks (genes, molecules, brain connections, etc.);
- 3D: Infrastructure networks (e.g., energy, transportation, internet, communication, etc.);

Graph (Graph)
1. Introduction to Graphs
To address the representation problem of non-Euclidean structured data, researchers have introduced the abstract concept of graphs from graph theory to represent non-Euclidean structured data.
2. Definition of Graphs
The definition of a graph is structured as shown in the figure below:
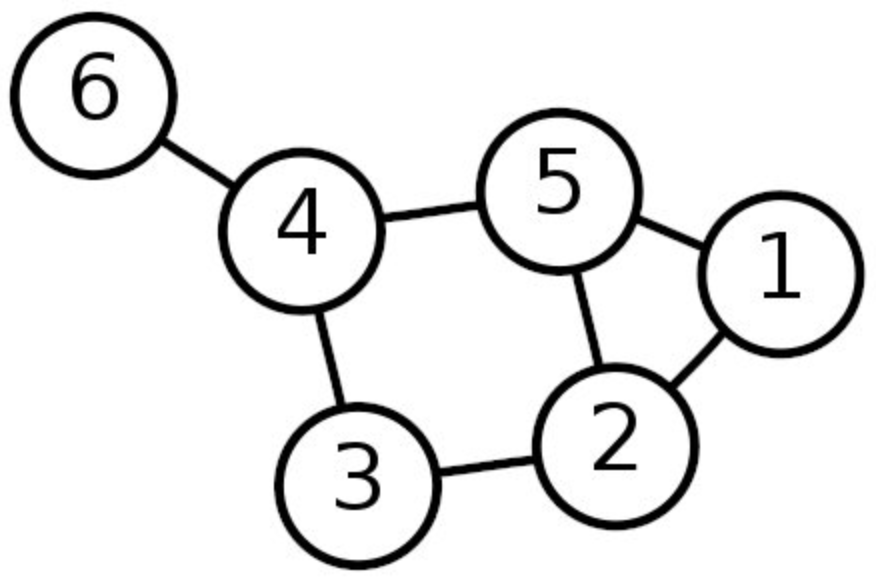
A labeled simple graph has a vertex set of:
The edge set of:
Additionally, represents vertices or nodes, where represents the number of nodes.
Indicates the edges connecting vertices;
3. Forms of Representation of Graphs
3.1 Adjacency Matrix
The adjacency matrix is a matrix whose elements are boolean values or weights, defined as follows:
If there is an edge connecting vertices and in the graph, then it is 1; otherwise, it is 0. When the graph is dense, the adjacency matrix is a suitable representation method. As shown in the figure below:
+---+---+---+---+---+---+---+
|   | 1 | 2 | 3 | 4 | 5 | 6 |
+---+---+---+---+---+---+---+
| 1 | 0 | 1 | 0 | 0 | 1 | 0 |
+---+---+---+---+---+---+---+
| 2 | 1 | 0 | 1 | 0 | 0 | 0 |
+---+---+---+---+---+---+---+
| 3 | 0 | 1 | 0 | 1 | 0 | 0 |
+---+---+---+---+---+---+---+
| 4 | 0 | 0 | 1 | 0 | 1 | 1 |
+---+---+---+---+---+---+---+
| 5 | 1 | 0 | 0 | 1 | 0 | 0 |
+---+---+---+---+---+---+---+
| 6 | 0 | 0 | 0 | 1 | 0 | 0 |
+---+---+---+---+---+---+---+
The above figure shows the adjacency matrix representation.
3.2 Degree Matrix
The degree matrix is a diagonal matrix whose elements are the degrees of the nodes, defined as follows:
+---+---+---+---+---+---+---+
|   | 1 | 2 | 3 | 4 | 5 | 6 |
+---+---+---+---+---+---+---+
| 1 | 2 |   |   |   |   |   |
+---+---+---+---+---+---+---+
| 2 |   | 3 |   |   |   |   |
+---+---+---+---+---+---+---+
| 3 |   |   | 2 |   |   |   |
+---+---+---+---+---+---+---+
| 4 |   |   |   | 3 |   |   |
+---+---+---+---+---+---+---+
| 5 |   |   |   |   | 3 |   |
+---+---+---+---+---+---+---+
| 6 |   |   |   |   |   | 1 |
+---+---+---+---+---+---+---+
The above figure shows the degree matrix representation.
3.3 Neighborhood
The neighborhood represents the set of points connected by edges to a certain vertex, defined as follows:
For example, the neighborhood of node is .
Learning Tasks on Graphs
After introducing the basic terminology of graphs, let’s look at what machine learning tasks we can perform with graph-structured data.
- Graph Node Classification Task: Each node in the graph has corresponding features. When we know the categories of some nodes, we can design a classification task to classify unknown nodes. The GCN, GraphSAGE, and GAT models we will introduce next are all for node classification on graphs.
- Graph Edge Structure Prediction Task: The relationships between nodes in the graph may be collected from the input data, while some hidden edges need to be discovered, which is the prediction task for edges, i.e., predicting the relationships between nodes.
- Graph Classification: For the entire graph, we can also classify the graph. Graph classification, also known as the graph isomorphism problem, is based on the idea of aggregating the features of the nodes in the graph to form the features of the graph for classification.
Examples of Graph Data Applications
For a simple e-commerce graph, it includes three key nodes: sellers, products, and users. Among them, the product nodes are associated with product category nodes, and the user nodes are associated with registration IP nodes and registration address nodes. When a user purchases a product, the user node and product node will be linked to a transaction node, while the transaction node will also be linked to the corresponding IP node and delivery address node at the time of the user’s order. The corresponding graph structure is shown in the figure below.
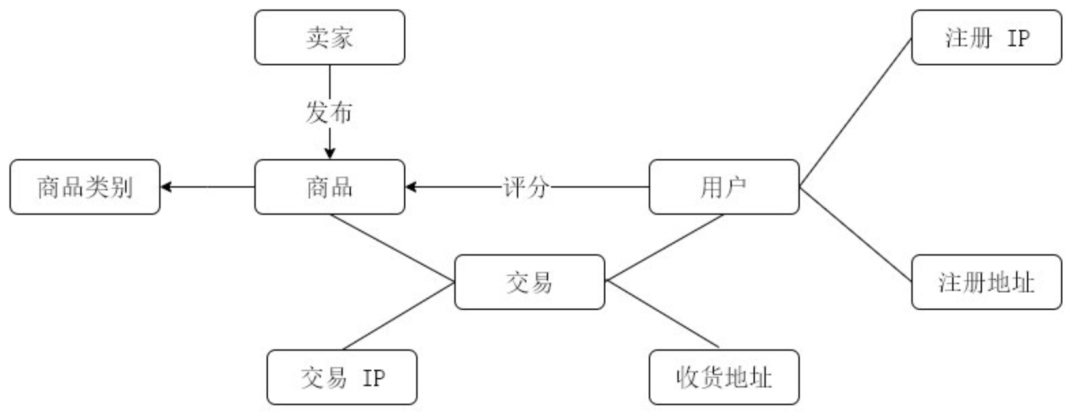
From the relationships and features between nodes in graph data, we can perform anti-fraud and product recommendation operations.
- Node Classification – Anti-Fraud: Since each node in the graph has its feature information, we can build a risk control system based on this feature information. If the IP and delivery address associated with the transaction node do not match the registered IP and registered address of the user, the system may consider that the user has a risk of fraud.
- Edge Structure Prediction – Product Recommendation: Each node in the graph has structural information. If a user frequently purchases a certain category of products or rates a certain category of products highly, the system can determine that the user is interested in that category of products, so it can recommend more products of that category to the user.
In summary, the rich application value of graph data encourages more researchers to join the study of graph data. However, when analyzing graph data, we need to consider both the feature information and structural information of the nodes. If we rely on manual rules to extract, we will lose many hidden and complex patterns. So, is there a method that can automatically learn both the feature information and structural information of graphs? This is a hot direction in machine learning that has emerged in recent years – Graph Neural Networks (GNN). Next, we will introduce them in a series of articles.
Good news!
Beginner's Visual Learning Knowledge Planet
is now open to the public👇👇👇


Download 1: OpenCV-Contrib Extension Module Chinese Version Tutorial
Reply in the "Beginner's Visual Learning" public account backend: Extension Module Chinese Tutorial, to download the first Chinese version of the OpenCV extension module tutorial on the internet, covering installation of extension modules, SFM algorithms, stereo vision, object tracking, biological vision, super-resolution processing, etc., over twenty chapters of content.

Download 2: Python Visual Practice Projects 52 Lectures
Reply in the "Beginner's Visual Learning" public account backend: Python Visual Practice Projects, to download 31 visual practical projects including image segmentation, mask detection, lane line detection, vehicle counting, eyeliner addition, license plate recognition, character recognition, emotion detection, text content extraction, face recognition, etc., to help quickly learn computer vision.

Download 3: OpenCV Practical Projects 20 Lectures
Reply in the "Beginner's Visual Learning" public account backend: OpenCV Practical Projects 20 Lectures, to download 20 practical projects based on OpenCV for advanced learning of OpenCV.

Group Chat

Welcome to join the reader group of the public account to communicate with peers. Currently, there are WeChat groups for SLAM, 3D vision, sensors, autonomous driving, computational photography, detection, segmentation, recognition, medical imaging, GAN, algorithm competitions, etc. (which will gradually be subdivided). Please scan the WeChat number below to join the group, and note: "Nickname + School/Company + Research Direction", for example: "Zhang San + Shanghai Jiao Tong University + Visual SLAM". Please follow the format for notes; otherwise, you will not be approved. After successful addition, you will be invited to relevant WeChat groups based on your research direction. Please do not send advertisements in the group; otherwise, you will be removed from the group. Thank you for your understanding~