
Fishery analysis using gradient-dependent optimal interpolation
Chunling Zhang1 , Danyang Wang1 , Zhenfeng Wang2
1.College of Marine Sciences, Shanghai Ocean University, Shanghai 201306, China
2.Project Management Office of China National Scientific Seafloor Observatory, Tongji University, Shanghai 200092, China
Abstract
The current lack of high-precision information on subsurface seawater is a constraint in fishery research. Based on Argo temperature and salinity profiles, this study applied the gradient-dependent optimal interpolation to reconstruct daily subsurface oceanic environmental information according to fishery dates and locations. The relationship between subsurface information and matching yellowfin tuna (YFT) in the western and central Pacific Ocean (WCPO) was examined using catch data from January 1, 2008 to August 31, 2017. The seawater temperature and salinity results showed differences of less than ±0.5°C and ±0.01 compared with the truth observations respectively. Statistical analysis revealed that the most suitable temperature for YFT fishery was 28–29°C at the near-surface. The most suitable salinity range for YFT fishery was 34.5–36.0 at depths shallower than 300 m. The suitable upper and lower bounds on the depths of the thermocline were 90–100 m and 300–350 m, respectively. The thermocline characteristics were prominent, with a mean temperature gradient exceeding 0.08°C/m. These results indicate that the profiles constructed by gradient-dependent optimal interpolation were more accurate than those of the nearest profiles adopted.
Keywords: gradient-dependent optimal interpolation, YFT, Argo profiles, WCPO
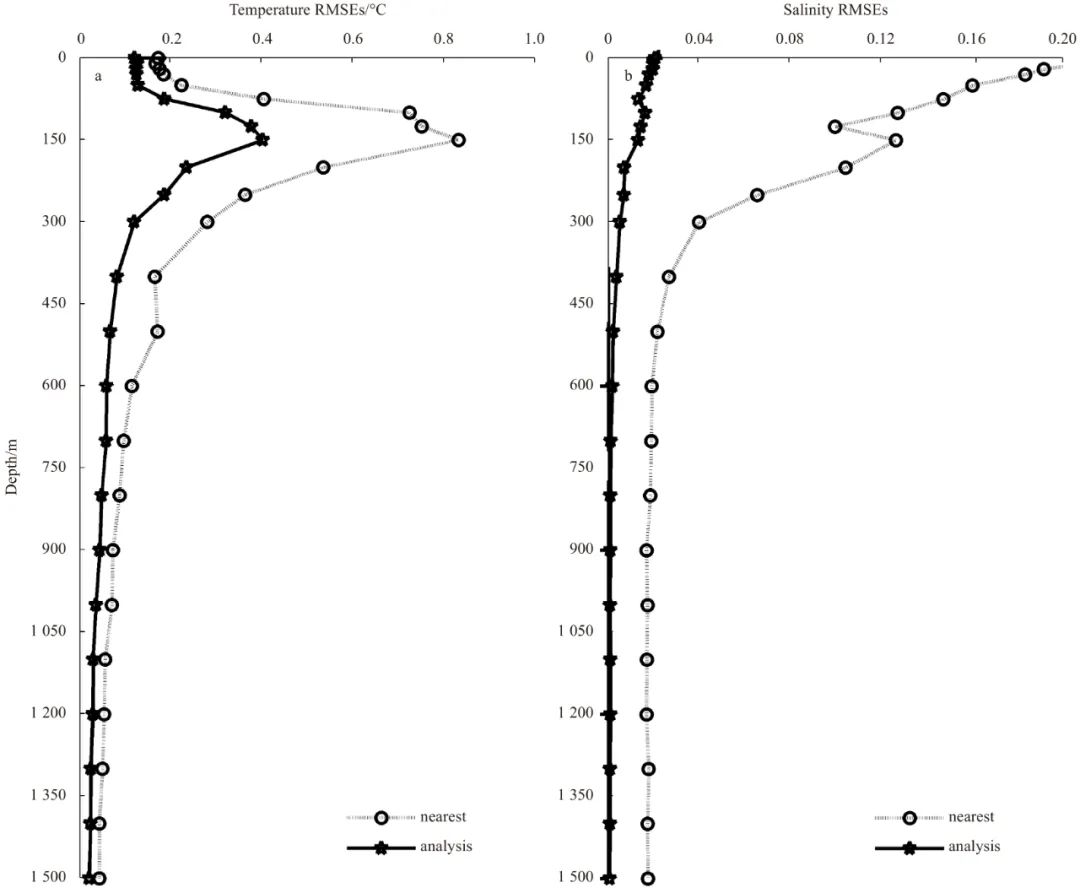
Figure 1. Root mean square errors (RMSEs) of 30 sample points from the analysis results (indicated by dots) and nearest profiles (indicated by circles) at a depth range of 5 m to 1500 m.
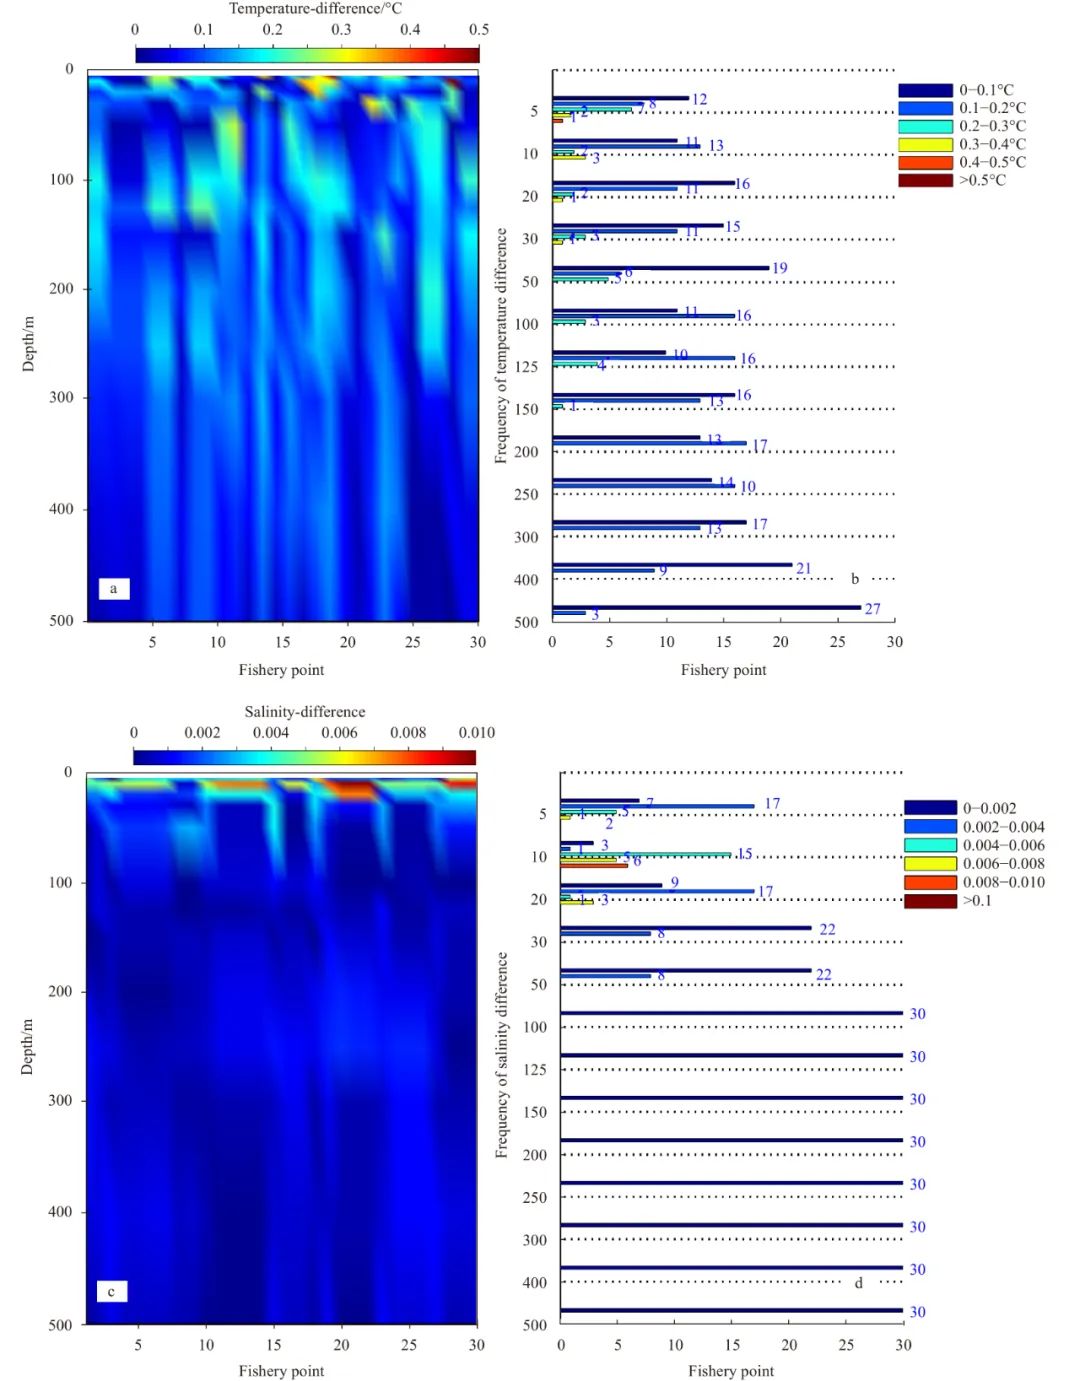
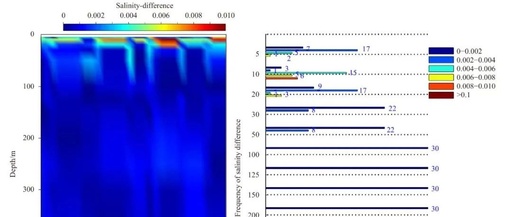
Figure 2. Temperature and salinity differences between 5 m to 500 m at each fishery point. a and c show the vertical difference distribution, whereas b and d are the difference frequency at each depth.
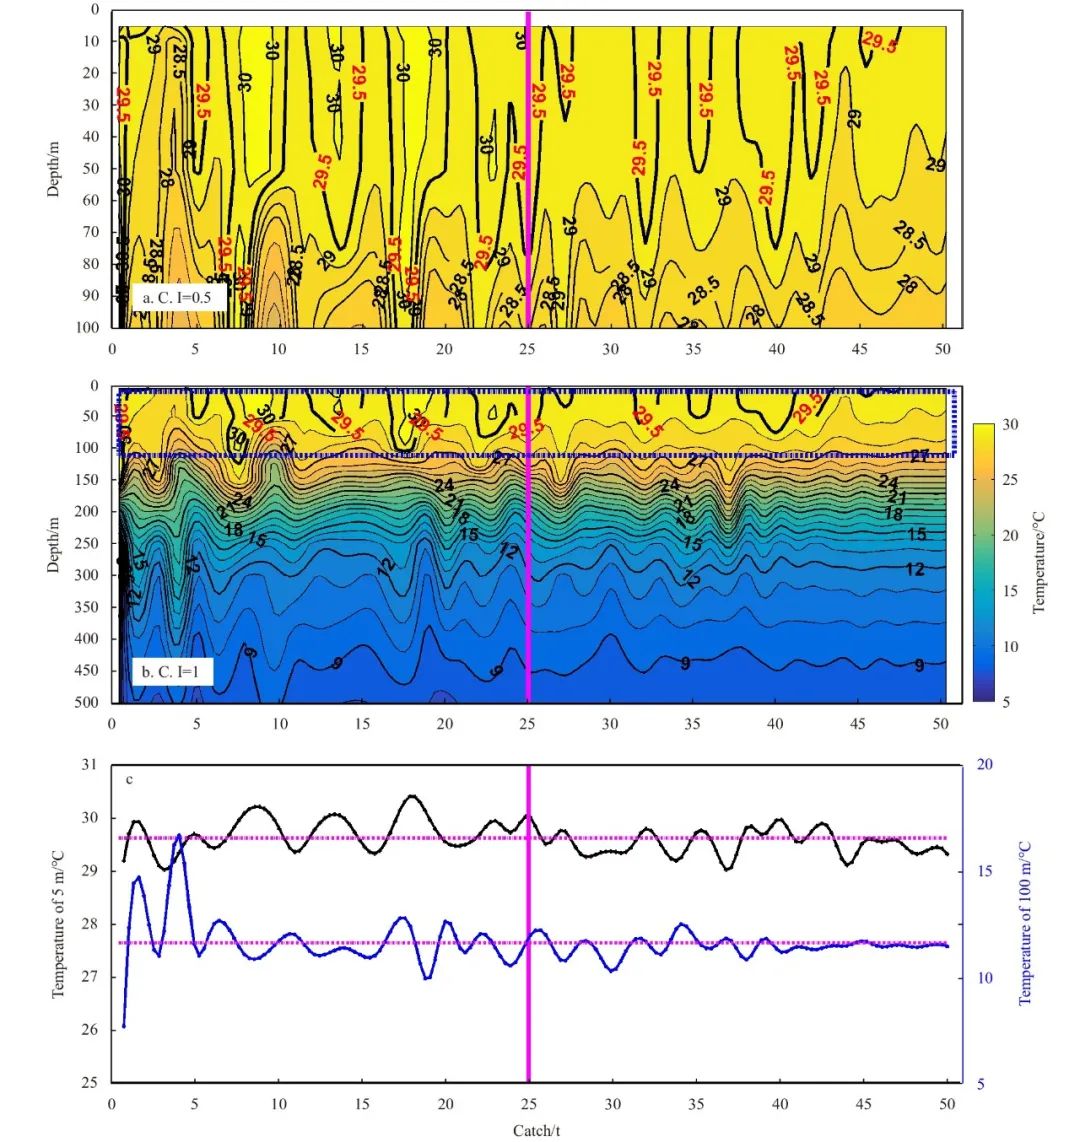
Figure 3. Temperature section at the depth range from 5 m to 100 m (a), 5 m to 500 m (b), and temperature curves at 5 m and 100 m (c) for different catch. The temperatures at every water layer were interpolated to the catch sequence. C. I indicates the contour intervals.
Funds
The National Natural Science Foundation of China under contract No. 4210060098; the Foundation of Key Laboratory of Sustainable Exploitation of Oceanic Fisheries Resources under contract No. A1-2006-21-200201.
Click to read the original text and download the full text