Background:
The internationally recognized academic organization the IEEE International Conference on Data Mining (ICDM) selected the top ten classic algorithms in the field of data mining in December 2006:C4.5、k-Means、SVM、Apriori、EM、PageRank、AdaBoost、kNN、Naive Bayes and CART。 Not only are the selected ten algorithms classic, but actually any of the 18 algorithms that participated in the selection can also be considered classic algorithms, which have had a profound impact in the field of data mining.
Algorithm Overview:
The k-means algorithm is a clustering algorithm that partitions n objects into k segments based on their attributes, where k < n. It is similar to the maximum expectation algorithm used for handling mixed normal distributions, as both aim to find the centers of natural clusters in the data. It assumes that the object attributes come from spatial vectors, and the goal is to minimize the total squared error within each group.
Assume there are k groups Si, i=1,2,…,k. μi is the centroid of all elements xj in group Si, also called the center point. The k-means clustering was invented in 1956, and its most common form uses an iterative improvement method known as the Lloyd algorithm. The Lloyd algorithm first divides the input points into k initial groups, which can be random or based on some heuristic data. Then, it calculates the center point of each group and reassigns objects to the nearest center based on the center point’s location, redefining the groups. This process continues until convergence, meaning that the objects no longer change groups (the center point’s position no longer changes). The Lloyd algorithm is closely related to k-means, but in practice, the Lloyd algorithm is a heuristic for solving the k-means problem. For certain combinations of starting points and centroids, the Lloyd algorithm may actually converge to incorrect results (different optimal solutions may exist in the above function). Although there are variations, the Lloyd algorithm remains popular because it converges very quickly in practice. In fact, it has been observed that the number of iterations is far less than the number of points. However, recently, David Arthur and Sergei Vassilvitskii proposed that there exist specific sets of points that cause the k-means algorithm to take super-polynomial time to converge. Approximate k-means algorithms have been designed to compute on subsets of the original data. From the algorithm’s performance perspective, it does not guarantee a global optimal solution, and the final solution’s quality largely depends on the initial grouping. Due to the algorithm’s speed, a common approach is to run the k-means algorithm multiple times and select the optimal solution. One disadvantage of the k-means algorithm is that the number of groups k is an input parameter, and an inappropriate k may return poor results. Additionally, the algorithm assumes that the squared error is the best parameter for calculating group dispersion.
Algorithm Principles:
Clustering algorithms are used to discover the similarity of data items based on their features and place similar data items in the same group, with similarity described using distance.
K-means Clustering
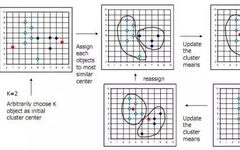
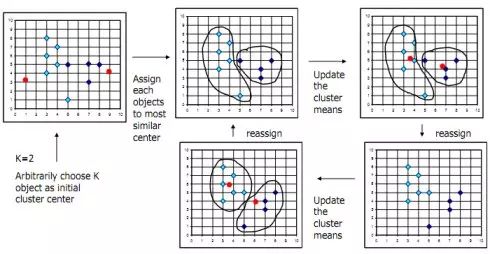
In simple terms, the general process is as follows: first randomly select k points, assign each point to them, obtaining the initial k classifications; calculate the mean within each classification, reassign points to the closest center; repeat the above steps until the assignment of points no longer changes. The following diagram illustrates the K-means method.
The SAS Implementation of K-Means Algorithm The k-means algorithm can be implemented using SAS’s proc fastclus. This primarily involves two issues. First is the selection of initial points. If replace=random is specified, the system randomly selects a complete observation as the centroid based on the number specified by the maxcluster option. If the analyst has a good understanding of the research scenario, they can specify the initial classification based on their expertise, setting the seed=dataset option in proc fastclus, allowing SAS to read the first k observations from the dataset as the initial centroids. Additionally, SAS offers a method for automatically selecting initial centroids, which requires specifying the maxclusters and radius options, where radius is the minimum allowable distance between centroids. The default values are maxclusters=100 and radius=0, meaning it selects the first 100 observations in the dataset as centroids. The fastclus process always selects the first complete observation as the first centroid, then examines the remaining observations, with those having a distance greater than the specified radius from the first centroid becoming the second centroid. When the number of centroids has not reached maxcluster, and the examined observations are all greater than the specified radius from existing centroids, the examined observation becomes the next centroid. If an observation is complete and its distance from all centroids is greater than radius, but the number of centroids has reached the maximum, the fastclus process performs two replacement tests to see if the current observation can replace an existing centroid. The first test is the nearest two centroids replacement test, where if the centroid’s minimum distance to the current observation is greater than the minimum distance of existing centroids, one existing centroid will be replaced, and the current observation will replace one of the nearest two centroids, ensuring that the current observation is as far as possible from the remaining centroid. The second test is the current observation nearest centroid replacement test, where if the minimum distance from the current observation to all centroids except the nearest is greater than the minimum distance of the nearest centroid to all other centroids, a replacement is made. If both tests indicate that the observation cannot replace existing centroids, it moves to the next observation until all observations in the dataset have been examined. Of course, this detection can be controlled using replace=none|part|full, where none means no replacement test is conducted, part means only the first replacement test is conducted; full is the default, where both replacement tests are conducted. The second issue is the method of modifying classifications. The default method is the batch modification method, where a batch of centroids is selected; all observations are classified based on their nearest centroid; the mean of each class is calculated, and the mean is used as the new centroid. If the new centroid completely overlaps with the old centroid, the algorithm terminates; otherwise, reclassification occurs. The batch modification method changes centroids only after all observations have been adjusted, while the individual modification method changes the centroid immediately after each observation is adjusted and requires the algorithm to verify whether the modified centroid set still satisfies the radius constraint. If the radius constraint is not satisfied, SAS merges the two classes that are less than radius, calculates the mean, and uses it as the centroid of the merged class, repeating this process until the centroids meet the radius condition. To have SAS execute the individual modification method, the drift option needs to be declared. Supplement The problem with the k-means clustering algorithm is that the calculation of the mean is seriously affected by outliers. To overcome this issue, the K-medoids method can be used.
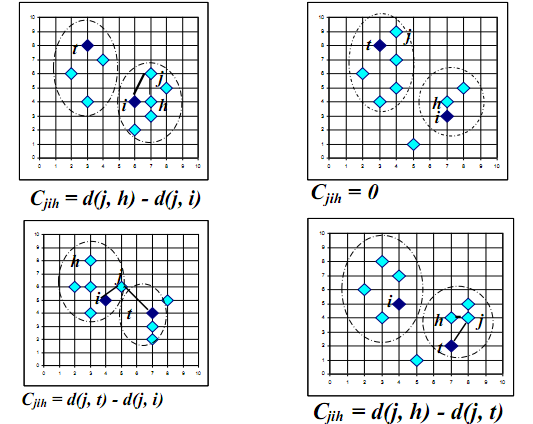
K-medoids Clustering PAM (Partition Around Medoids) is the foundational algorithm of K-medoids, with the basic process as follows: first randomly select k objects as centers, assign each object to the nearest center. Then randomly choose a non-center object to replace a center object and calculate the distance improvement after the assignment. The clustering process involves continuously iterating, repeatedly replacing center and non-center objects until the objective function no longer improves. The specific categories of replacing non-center and center points are analyzed in the following diagram (using h to replace i’s cost relative to j).
The problem with the PAM algorithm is poor scalability, requiring testing of all replacements and being suitable only for clustering small data sets.
To improve the scalability of this algorithm, the CLARAN algorithm was proposed, which essentially generates multiple sample datasets from the overall data and applies the PAM algorithm to each sample dataset to obtain a set of K medoids; the best set from all samples is taken as the final solution. The issue with the CLARAN algorithm is that the clustering quality depends on the quality of the samples.
To improve the clustering quality of the PAM and CLARAN algorithms, the CLARANS algorithm was proposed based on the CLARAN algorithm. The main difference from CLARAN is that the algorithm is not limited to a fixed sample at any given time; instead, the sample data is randomly drawn throughout the algorithm’s process. The algorithm proceeds as follows: each set of k medoids is treated as a node, and if two nodes share k-1 points, they are considered neighbors. The user specifies two numbers in advance: the maximum number of neighbors and the maximum number of local optimal points. The algorithm randomly selects a current point and randomly picks one of its neighbors to see if there is an improvement in the objective value. If there is an improvement, the neighbor replaces the current point, and the search for neighbors restarts; if the maximum number of neighbors is drawn and the current point is optimal, a local optimum has been found. After finding a local optimum, another current point is randomly selected, and the above process is repeated until the user-specified maximum number of local optimal points is found. Each local optimum’s objective value is compared, and the optimal point is taken as the result, thus easily obtaining k medoids, and therefore k classes can be easily obtained. The CLARANS algorithm performs well, but its algorithmic complexity is higher.


Did you know that many people don’t know that long pressing an image can also help you follow? Did you know?