
Introduction: Streamlit is an open-source Python library that allows you to easily create and share beautiful custom web applications for machine learning and data science. In just a few minutes, you can build and deploy powerful data applications while integrating with matplotlib to create stunning visualizations.
Historical Strategies:
matplotlib: heatmaps, box plots, violin plots, stacked area charts, radar charts, subplots
matplotlib: scatter plots, pie charts
matplotlib: Chinese display in pyplot
Python: opencv to draw points, circles, lines, polygons, rectangles
Python: data visualization – dynamic
Installation:
pip install streamlitVerify Installation:
streamlit hello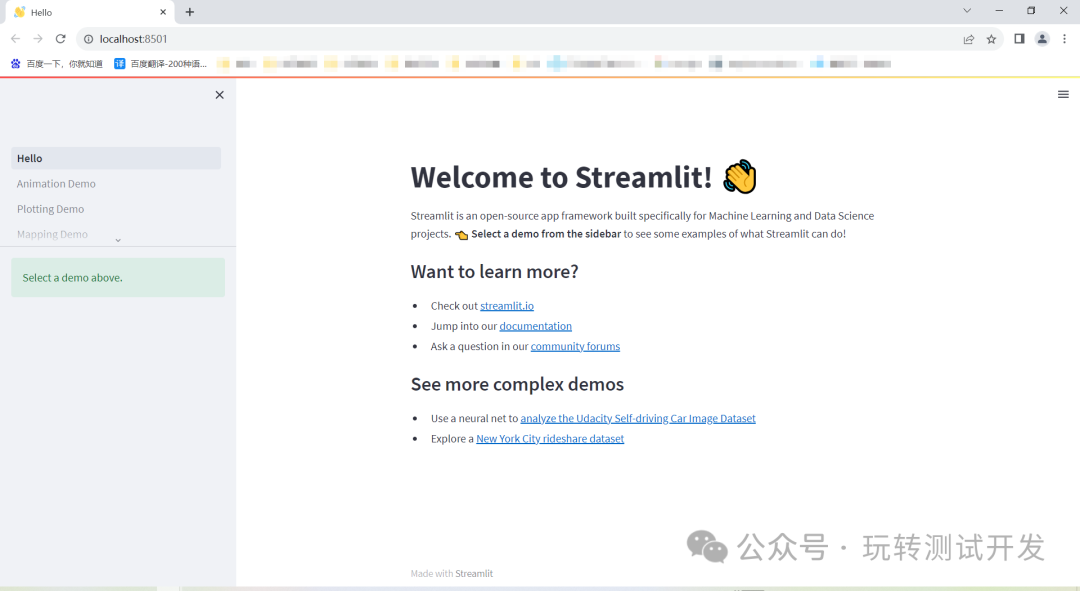
Basic Usage Steps:
1. Write code
2. Run in command line:
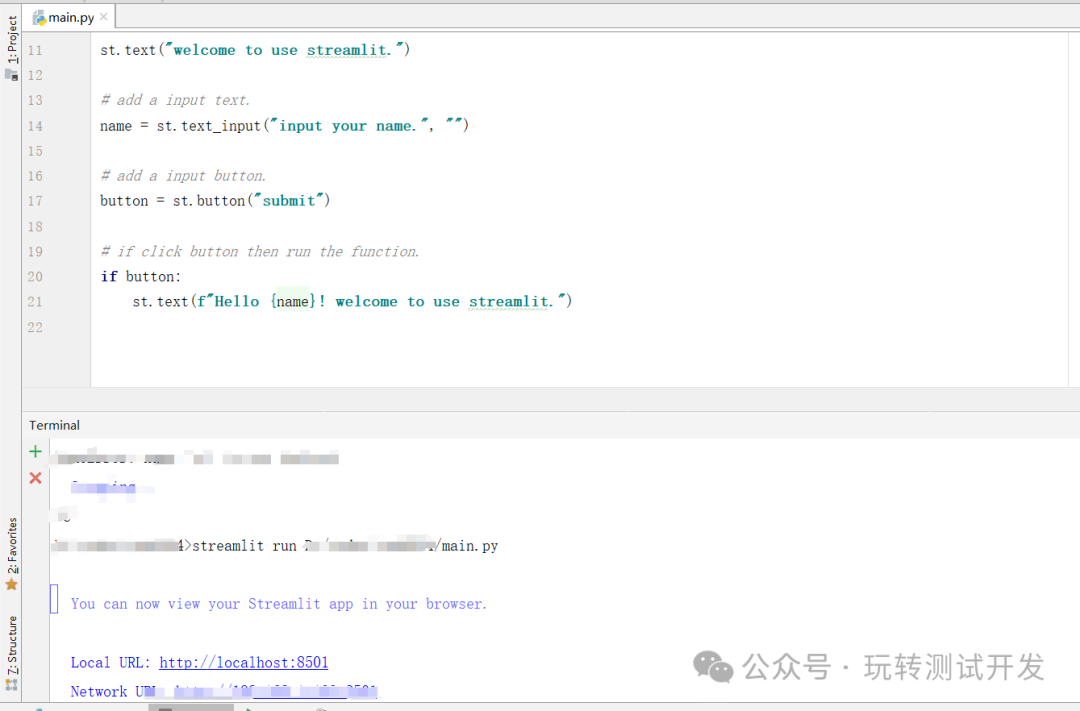
streamlit run main.py [ARGUMENTS]Example Source Code 1: Basic usage – main.py
# -*- coding: utf-8 -*-# time: 2024/3/3 22:58# file: main.py# WeChat Official Account: Testing Development
import streamlit as st
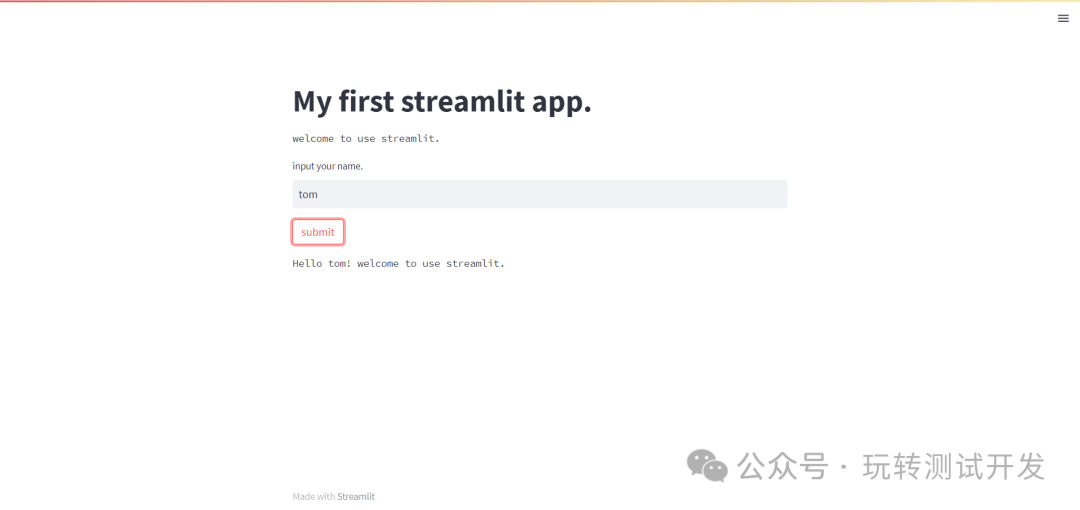
st.title("My first streamlit app.")
# add text.st.text("welcome to use streamlit.")
# add a input text.name = st.text_input("input your name.", "")
# add a input button.button = st.button("submit")
# if click button then run the function.if button: st.text(f"Hello {name}! welcome to use streamlit.")Run Result: streamlit run main.py [ARGUMENTS]
Example Source Code 2: Combining matplotlib, please refer to –
matplotlib: heatmaps, box plots, violin plots, stacked area charts, radar charts, subplots
Simply replace # plt.show() with
st.pyplot(plt)
# -*- coding: utf-8 -*-# time: 2024/3/3 23:05# file: run.py# WeChat Official Account: Testing Development
import streamlit as st
import matplotlib.pyplot as plt
import numpy as np
# case6 - Subplot data: Simulating user behavior data on Web and App
days = np.arange(1, 31)
web_traffic = np.random.randint(100, 1000, size=30)
app_traffic = np.random.randint(100, 1000, size=30)
web_clicks = np.random.randint(10, 100, size=30)
app_clicks = np.random.randint(10, 100, size=30)
# Create subplot layout
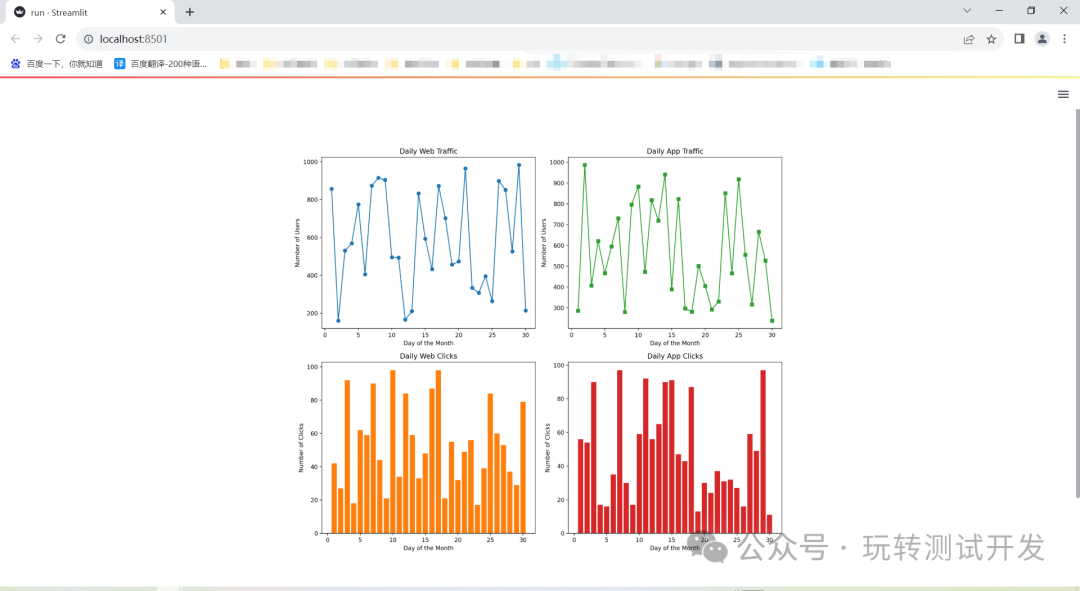
fig, axs = plt.subplots(2, 2, figsize=(12, 10))
# First subplot: Web traffic
axs[0, 0].plot(days, web_traffic, marker='o', color='tab:blue')
axs[0, 0].set_title('Daily Web Traffic')
axs[0, 0].set_xlabel('Day of the Month')
axs[0, 0].set_ylabel('Number of Users')
# Second subplot: App traffic
axs[0, 1].plot(days, app_traffic, marker='s', color='tab:green')
axs[0, 1].set_title('Daily App Traffic')
axs[0, 1].set_xlabel('Day of the Month')
axs[0, 1].set_ylabel('Number of Users')
# Third subplot: Web clicks
axs[1, 0].bar(days, web_clicks, color='tab:orange')
axs[1, 0].set_title('Daily Web Clicks')
axs[1, 0].set_xlabel('Day of the Month')
axs[1, 0].set_ylabel('Number of Clicks')
# Fourth subplot: App clicks
axs[1, 1].bar(days, app_clicks, color='tab:red')
axs[1, 1].set_title('Daily App Clicks')
axs[1, 1].set_xlabel('Day of the Month')
axs[1, 1].set_ylabel('Number of Clicks')
# Adjust layout
plt.tight_layout()
# plt.show()
st.pyplot(plt)Run Result: streamlit run run.py
Common Streamlit Components and Their Basic Usage:
# Titles and Text: st.title('Title'): Add a large title.
st.header('Title'): Add a larger title.
st.subheader('Title'): Add a smaller title.
st.text('Text'): Add a paragraph of text.

# Input Components: st.button('Button'): Add a button.
st.checkbox('Checkbox', value=False): Add a checkbox.
st.radio('Radio', options, index=0): Add a radio button.
st.selectbox('Dropdown', options, index=0): Add a dropdown.
st.multiselect('Multiselect', options, default=None): Add a multiselect.
st.slider('Slider', min_value, max_value, value=None, step=None): Add a slider.
st.text_input('Text Input', value='', max_chars=None): Add a text input.
st.number_input('Number Input', min_value=None, max_value=None, value=None, step=None): Add a number input.
st.text_area('Text Area', value='', max_chars=None): Add a text area.
st.date_input('Date Input', value=None, min_value=None, max_value=None): Add a date input.
st.time_input('Time Input', value=None): Add a time input.
st.file_uploader('File Uploader', type=None, accept_multiple_files=False): Add a file uploader component.

# Output Components: st.write('Text or Object'): Output text or object.
st.markdown('Markdown format text'): Support Markdown format text output.
st.latex('LaTeX format text'): Support LaTeX format text output.
st.code('Code Block'): Display code block.
st.json('JSON Data'): Display JSON data.
st.dataframe(data): Display Pandas dataframe.
st.table(data): Display table data.
st.image(image, caption=None, use_column_width=False): Display image.
st.audio(audio, format='audio/wav'): Play audio files.
st.video(video, format='video/mp4'): Play video files.

# Plotting Components: st.pyplot(fig): Display Matplotlib figures.
st.plotly_chart(fig): Display Plotly figures.
st.bokeh_chart(fig): Display Bokeh figures.
st.altair_chart(fig): Display Altair figures.

# Layout Components: st.sidebar: Create a sidebar.
st.expander('Title'): Create an expandable area.

# Advanced Features and Options: Cache Data: Use the st.cache decorator to cache function outputs for improved app performance.
Progress Bar: Use the st.progress component to show task progress.
State Management: Use st.session_state to manage state across sessions.
Asynchronous Updates: Use st.experimental_asyncio for asynchronous update functionality in applications.