
I always thought that building data applications was particularly troublesome; you need to understand both front-end and back-end, and also know how to deploy them.
It made someone like me, who is purely a data developer, feel overwhelmed.
However, I recently discovered a treasure tool, Streamlit, which is simply a timely rain for data developers!
With just a few lines of Python code, you don’t need to understand any complex web knowledge, and you can create beautiful data applications. It’s amazing!
1.
What is Streamlit?
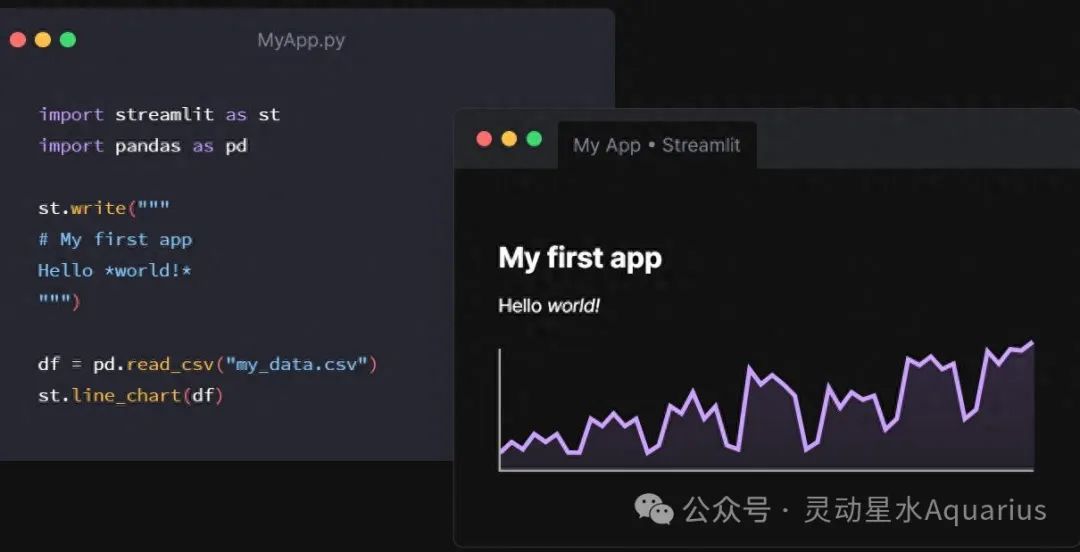
In simple terms, Streamlit is a Python library designed for data analysis and machine learning. The code written with it can directly become a web application without touching HTML. It’s as easy as writing a regular Python script.
import streamlit as st
st.title(‘My First Application’) name = st.text_input(‘Enter Your Name’) st.write(f’Hello, {name}!’)
See? With just a few lines of code, a small webpage that can input names is ready!
2.
Install and Start
Installing is super simple:
pip install streamlit
Once installed, you can use it. Create a Python file, for example, named <span>app.py</span>, and write some code:
import streamlit as st import pandas as pd
Read Data
df = pd.read_csv(‘data.csv’)
Display Data Table
st.dataframe(df)
Add a Selection Box
option = st.selectbox(‘Choose a Column’, df.columns)
Plot a Graph
st.line_chart(df[option])
To run, use:
streamlit run app.py
Your browser will automatically open, and a data display page will appear! No need to write any routing or API stuff.

3.
Add Interactive Components at Will
Streamlit has many built-in useful components:
Slider
age = st.slider(‘Choose Age’, 0, 100, 25)
Checkbox
agree = st.checkbox(‘Agree to Terms’)
Button
if st.button(‘Click Me to Predict’): st.write(‘Prediction Result is Here!’)
Friendly reminder: These components are automatically laid out, so you don’t have to worry about positioning. Just write and use them. Just be mindful of the execution order, as the code is re-executed from top to bottom.
4.
Data Visualization is a Breeze

Creating graphs is also quick:
import plotly.express as px
Create a Cool Scatter Plot
fig = px.scatter(df, x=’Height’, y=’Weight’, color=’Gender’) st.plotly_chart(fig)
Supports various data visualization libraries, including matplotlib, plotly, and altair. Moreover, the charts can automatically adapt to the page size, which is so smart!
5.
Machine Learning Models Can Also Be Deployed Instantly
Deploying models is the most headache-inducing task, but with Streamlit, it’s a breeze:
from sklearn.ensemble import RandomForestClassifier import pickle
Load the Trained Model
model = pickle.load(open(‘model.pkl’, ‘rb’))
Get User Input
features = st.number_input(‘Enter Feature Value’)
Prediction
if st.button(‘Predict’): result = model.predict([features]) st.success(f’The prediction result is: {result}’)
Once this code runs, you will have a webpage for online predictions. How convenient!
This tool is simply tailor-made for us data developers! No need to worry about complex web development knowledge, just focus on writing data processing code. If I had known about such a useful tool earlier, I wouldn’t have struggled for so long!
By the way, it can also be deployed to the cloud with one click, allowing others to use it.
If you want to try it out, I suggest starting with some simple data to get familiar with the basic operations. You’ll be able to get the hang of it quickly!
Recommended Reading
1. PyOmo – A Handy Assistant for Python Optimization Modeling2. NiBabel – The Magic Tool for Neuroimaging Files3. StellarGraph – Making Graph Machine Learning Simple and Fun