

Abstract: Stakeholder financial risk is one of the most socially harmful risks in financial risks. Effectively identifying stakeholder financial risks and safeguarding financial security is the core of financial risk prevention. In the field of stakeholder financial risk prevention, information extraction from multi-source heterogeneous data and the combination of data models are crucial. This article studies past relevant cases and combines the business accumulation of stakeholder financial risk identification to construct a stakeholder financial risk indicator system. It uses Borderline-SMOTE to process imbalanced samples in the training set and employs the XGBoost algorithm for modeling. The results show that this indicator system can effectively extract stakeholder financial risk information. Meanwhile, the training set processed by Borderline-SMOTE can significantly enhance the model’s ability to identify stakeholder financial risk enterprises.
Keywords:Stakeholder financial risk; Financial risk prevention; Financial regulation; XGBoost


Source | “Financial Technology Era” 2023, Issue 3
Authors | Guangzhou Financial Technology Co., Ltd. Li Jie, Zheng Longzhe, Huang Jiarong, Xiong Zilong, Jiang Haochang
Note: Please refer to the printed version of the current issue for the formulas contained in the text
Currently, the world is undergoing unprecedented changes intertwined with a century pandemic, and profound changes are taking place in the domestic and international financial environment, with a significant increase in factors threatening financial stability and security. The causes and forms of financial risks are becoming more complex, posing challenges to the healthy development of China’s financial market.
According to the clear requirements for financial work set forth at the 20th National Congress of the Communist Party, all types of financial activities must be regulated by law, firmly maintaining the bottom line of preventing systemic risks. To achieve this goal and effectively safeguard the overall development of financial security, it is necessary to closely monitor various financial risk points. Among various financial risks, stakeholder financial risk has become a key focus of financial risk prevention due to its stakeholder characteristics and the serious social harm it can cause.
Stakeholder financial risks involve a wide range of areas, with diverse criminal methods and considerable difficulty in identification and detection. In recent years, due to the rise of P2P online lending platforms, stakeholder financial risks in related fields have become prominent, and past research has mainly focused on monitoring and identifying risks associated with P2P platforms. Lin Chunyu et al. (2015) used big data and machine learning technologies to establish a multi-dimensional evaluation index for stakeholder financial risks and constructed a warning model for P2P online lending platforms to monitor fundraising risks. Yan Wu et al. (2019) collected public data from P2P platforms using web crawling technology and established a stakeholder financial risk warning model using machine learning algorithms. By comparing traditional regression and ensemble learning methods such as random forests, they found that ensemble learning algorithms had higher accuracy than traditional regression algorithms. Li Shuang et al. (2022) referred to the “three characteristics” principle of risk assessment in Chinese commercial banks and the LAPP method to establish a risk indicator system for P2P online lending platforms. Based on data from the Wangdai Zhi Jia platform, they used Naive Bayes, random forests, and other machine learning algorithms to build models, discovering that the Naive Bayes model had the strongest identification ability.
In recent years, due to the introduction of national policies, P2P platforms have gradually been phased out, but stakeholder financial risks continue to appear in various forms, such as through debt, equity, sales of goods, and production operations, attracting customers by promoting high yields and returns.
Through research on past literature, it has been found that there is currently little research on stakeholder financial risk identification models in China. Moreover, past P2P online fundraising risk identification models have also been phased out due to the withdrawal of P2P platforms. Therefore, to effectively identify and monitor stakeholder financial risks, this article fully utilizes the business experience and data resources accumulated by enterprises to construct a risk indicator system and employs machine learning algorithms for modeling and identification, serving the broader goal of maintaining stability in the financial market order, which has strong practical application value.
(1) XGBoost Algorithm
Chen T and Guestrin C (2016) efficiently implemented the GBDT algorithm and developed the eXtreme Gradient Boosting (XGBoost) algorithm, proposing many engineering improvements. XGBoost is a boosting ensemble algorithm for learning, which significantly reduces the time consumption of feature value sorting through parallel computation at the feature granularity level. It also explicitly adds regularization terms to control the complexity of the model, offering advantages such as speed, multi-threaded parallel processing, and prevention of overfitting. XGBoost continuously generates new decision trees to fit the residuals of previous decision trees, reducing the residuals between the model’s predictions and true values, thereby improving the model’s prediction accuracy. The prediction values of the XGBoost algorithm can be expressed in the following additive form:(1)
Where K is the output value of K trees; K is the number of trees in XGBoost; fk is the k-th sub-model; xi is the i-th input sample; F is the collection of all trees. The objective function of XGBoost consists of two parts: the loss function and the regularization term:(2)(3)
Where is the objective function at the t-th iteration; is the predicted value at the t-1 iteration; is the regularization term at the k-th iteration to prevent overfitting; γ and λ are the coefficients of the regularization term, reducing the complexity of the decision tree; T is the number of leaf nodes.
Using Taylor’s formula to expand the objective function in (2) at the second order gives:(4)(5)
Where gi is the first derivative of the i-th sample xi; hi is the second derivative of the i-th sample xi; ωj is the output value of the j-th leaf node; Ij is the subset of samples for the j-th leaf node.
From (5), it can be seen that the objective function is a convex function. By deriving ωj and setting the derivative to zero, we can find the ωj that minimizes the objective function, namely:(6)(7)
(7) can evaluate the quality of a tree model; the smaller the value, the better the tree model. The node split in XGBoost is determined by the change in information gain. If the current node can be split with an information gain greater than 0, the node will be split; otherwise, it will not be split. The formula for calculating information gain is as follows:(8)
(2) Model Evaluation Indicators
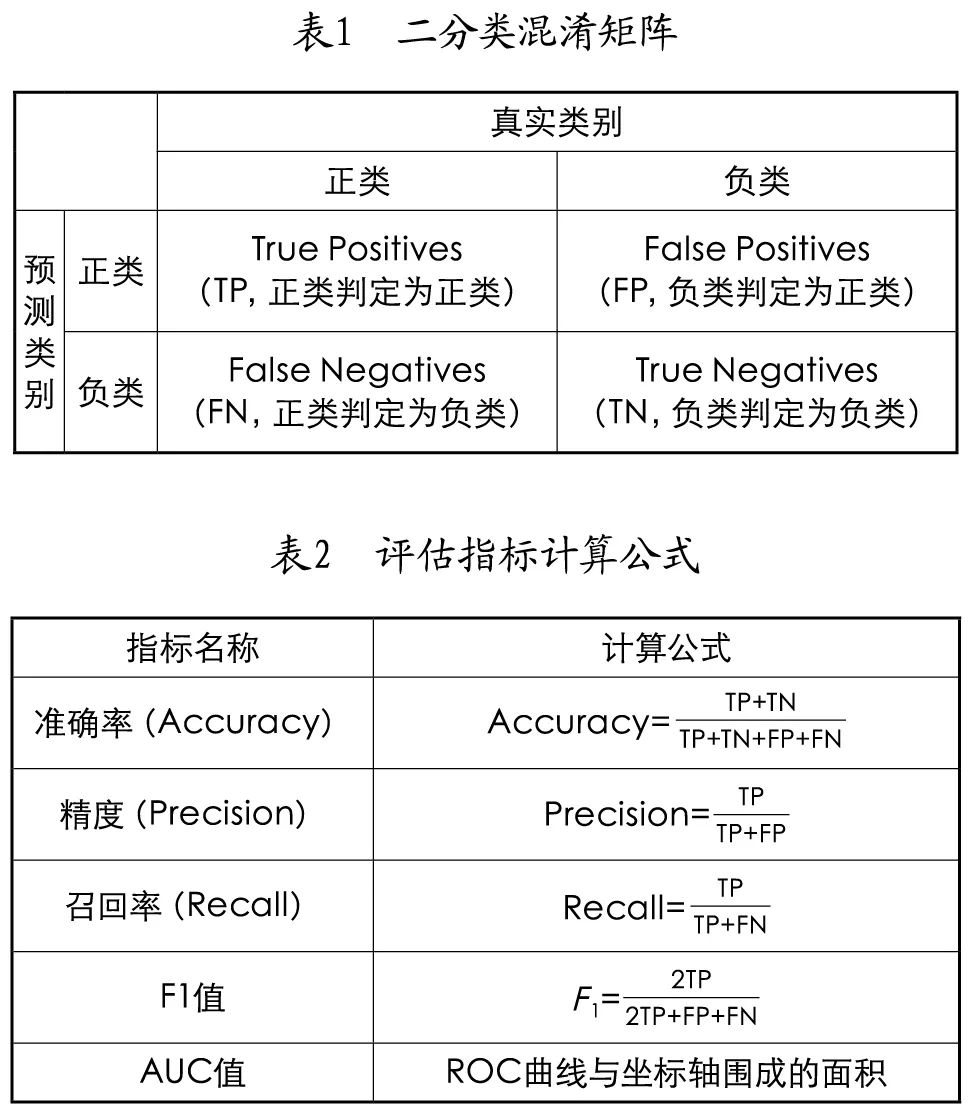
To comprehensively evaluate the model’s identification ability, this article selects accuracy, precision, recall, F1 score, and AUC value to validate the model results. Accuracy refers to the proportion of correctly predicted samples in the total number of samples and can be used to assess the overall identification effect; precision indicates the proportion of actual positive samples among those predicted as positive, assessing the model’s ability to identify positive samples; recall refers to the proportion of samples that are actually positive and predicted as positive, used to evaluate the model’s ability to identify all positive samples; the F1 score is the harmonic mean of precision and recall, allowing for a comprehensive evaluation of both; the AUC value refers to the area under the ROC curve, primarily used to assess the model’s classification ability.
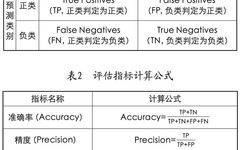
During model testing, four possible outcomes will occur, as listed in Table 1. The relevant calculation formulas are listed in Table 2.
(1) Sample Selection
This study focuses on stakeholder financial risk enterprises, with the list of relevant enterprises sourced from the stakeholder financial risk data system developed by Company G’s Golden Eagle system. This article extracts 3,000 sample data of stakeholder financial risk enterprises from this system, deduplicating the data based on subjects to obtain a sample of 640 enterprises (the positive samples in this article). The non-stakeholder financial risk sample (the negative samples in this article) was randomly selected from over 600,000 enterprises monitored by the Golden Eagle system, resulting in 9,900 normally operating enterprises. The positive and negative sample datasets were divided into training and testing sets at an 8:2 ratio. Sample enterprise data mainly comes from Guangdong Province’s local financial risk database.
(2) Data Processing
1. Indicator Design
In constructing the stakeholder financial risk identification model, this article refers to Company G’s past experience in identifying stakeholder financial risk enterprises, utilizing data from business registration, public opinion, recruitment, legal documents, etc., to create a practical indicator system. This indicator system includes administrative penalty indicators, dishonest person indicators, legal document indicators, public opinion indicators, etc.
2. Missing Value Processing
Since some business indicators designed in this article are primarily used to extract information about enterprises suspected of engaging in stakeholder financial risk activities, most normal enterprises will lack the data to calculate related indicators. Considering the practical significance of the indicators, this article uses a “0” value or mode to fill in missing values to minimize the impact on subsequent data processing and modeling.
3. Class Imbalance Processing
XU Lingling and Chi Dongxiang (2020) researched the impact of imbalanced datasets on machine learning classification performance and proposed solutions from both data and model improvement perspectives. In this classification task, due to the significant imbalance in the ratio of positive to negative samples in the training set (1:16), the model’s ability to identify positive samples is insufficient. Therefore, this article refers to the above strategies and uses Borderline-SMOTE to augment the positive samples in the training set.
4. Data Binning and Encoding
Data binning is part of data preprocessing, essentially grouping data based on certain rules to enhance model stability and robustness while reducing the risk of overfitting. There are many methods for data binning, commonly including equal-width binning, equal-depth binning, IV value binning, optimized binning, and chi-square binning. This article primarily determines the binning intervals by calculating the IV values after binning.
After completing data binning, this article uses Weight of Evidence (WOE) to encode the indicators, primarily by calculating the ratio of positive and negative samples in the binned intervals. For the i-th group, the WOE calculation formula is as follows:(9)
Where: Pyi is the proportion of positive samples in the total positive samples for that group; Pni is the proportion of negative samples in the total negative samples for that group; yi is the number of positive samples in that group; ni is the number of negative samples in that group; yT is the total number of positive samples; nT is the total number of negative samples. At this point, the IV value for the i-th group is:(10)
If the IVI=max{(IVi|i=1,2,3,…,N)} during this traversal, the binary interval of IVI is taken as the division point for this partition, dividing the original indicator data into two segments. This partitioning operation is repeated until the IV value no longer increases, resulting in the final partition intervals for the indicators. The WOE encoding for the final partition intervals of each indicator yields the dataset before modeling, used for subsequent modeling.
(3) Experimental Results
To evaluate the effects of each model before and after processing the imbalanced samples in the training set, this article uses Decision Tree (DT), Random Forest (RF), Gradient Boosting Decision Tree (GBDT), and XGBoost to train on the training set before and after processing the imbalanced samples based on the datasets and evaluation indicators mentioned above. The results are listed in Table 3.
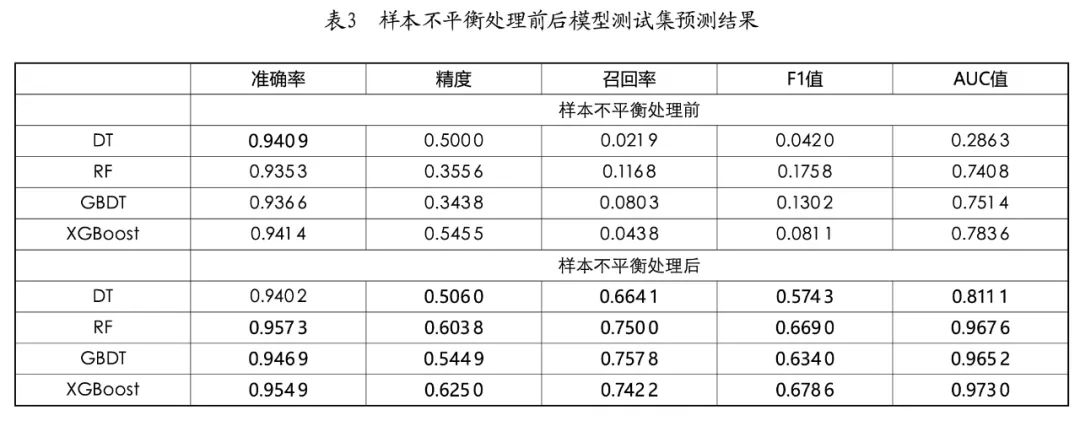
After processing the imbalanced samples in the training set, overall, the change in accuracy for each model was not significant, but precision, recall, F1 score, and AUC value showed significant improvements. In terms of recall, except for the decision tree, the other models could achieve around 0.75, indicating that the models can identify about 75% of the positive samples in the test set, demonstrating good identification ability for positive samples. Simultaneously, the precision of all models could reach 0.5-0.6, indicating that 50%-60% of the predicted positive samples were true positive samples, showing good recognition precision for positive samples. With both precision and recall being relatively high, the F1 values of RF, GBDT, and XGBoost models could all exceed 0.6, and the AUC values were all above 0.96, indicating good classification and identification ability of the models.
From the perspective of individual models, the DT model performed poorly, while the RF, GBDT, and XGBoost models achieved good identification results in this classification task. Among them, RF achieved the best accuracy at 0.9573; GBDT achieved the best recall at 0.7578; XGBoost achieved the best results in precision, F1 value, and AUC value, reaching 0.6250, 0.6786, and 0.9730, respectively. Overall, among all models, XGBoost demonstrated the best identification ability for this task, correctly identifying 95.49% of the test set samples, with 62.50% of the predicted positive samples being true positive samples, and identifying 74.22% of the positive samples in the test set. Additionally, this model also achieved good results in the classification ability evaluation indicators F1 value and AUC value.
This article combines the actual business scenarios of enterprises and fully utilizes the data resources, business knowledge reserves, and relevant technical capabilities of Company G to establish a set of stakeholder financial risk indicator systems and identification models with practical business application value.
The research results indicate that the indicator system designed in this article can effectively extract stakeholder financial risk information from enterprises. Furthermore, the Borderline-SMOTE method used in this article can effectively address the issue of insufficient model identification ability caused by sample imbalance. Simultaneously, this article finds that the XGBoost model performs well in this classification task, demonstrating strong identification ability for stakeholder financial risk enterprises.
References:
[1] Lin Chunyu, Li Chonggang, Xu Fangyuan, et al. Risk warning model for P2P online lending platforms based on big data technology [J]. Big Data, 2015(4):10-20.
[2] Yan Wu, Feng Lingbing, Jiang Zhihui, et al. Research on risk warning for P2P online lending platforms based on machine learning models [J]. Finance and Economics, 2019(9):18-25.
[3] Li Shuang, Liu Yaya, Li Xiaotong. Risk monitoring and warning for P2P online lending platforms based on machine learning [J]. Journal of Xi’an University of Finance and Economics, 2022(2):62-73.
[4] Xu Lingling, Chi Dongxiang. Machine learning classification strategies for imbalanced datasets [J]. Computer Engineering and Applications, 2020(24):12-27.
[5] Chen T, Guestrin C. XGBoost: A scalable tree boosting system [C]//Proceedings of the 22nd ACM SIGKDD International Conference on Knowledge Discovery and Data Mining, 2016.


Click to Download Subscription Order Click to Fill Order Online