

This article is approximately 4300 words, and is recommended for a reading time of 10 minutes.
This article explains how to create applications that support data science projects using StreamLit.

The Zen of Python: Simple is better than complex.Streamlit is the best footnote to this, making the creation of web applications simpler than ever.
pip install streamlitstreamlit hello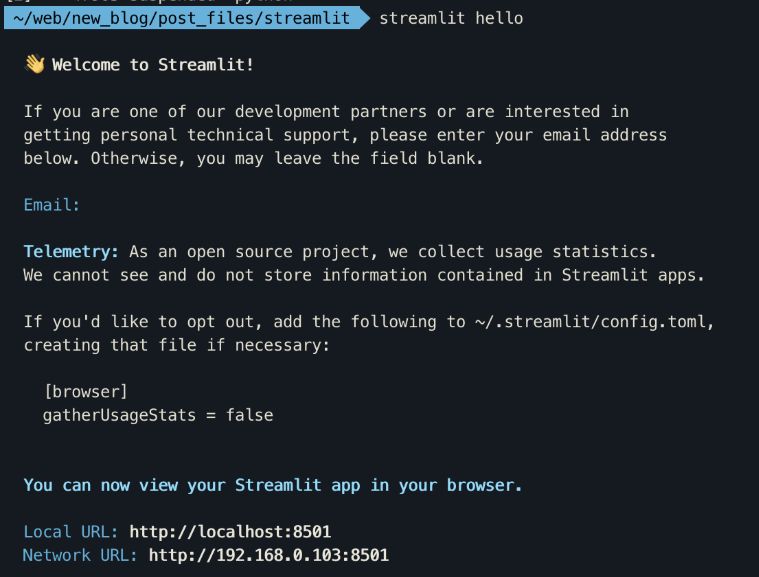
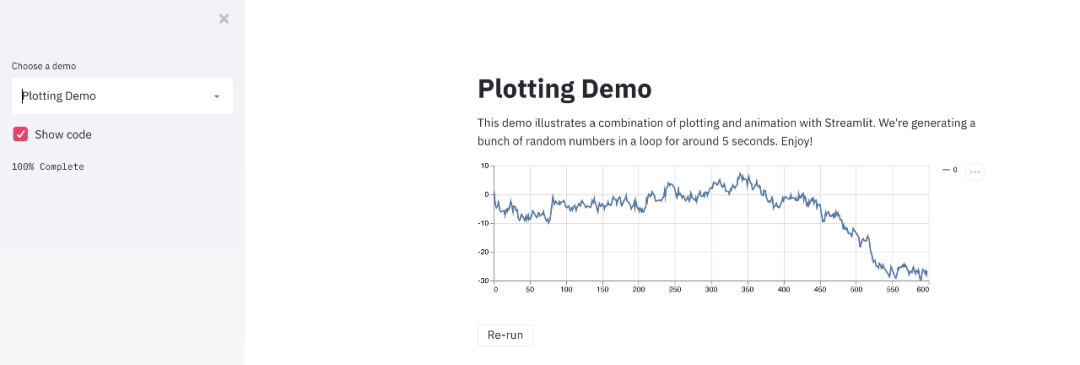
Streamlit Hello World
import streamlit as st
x = st.slider('x')
st.write(x, 'squared is', x * x)streamlit run helloworld.py
-
st.slider widget command, which implements the effect of sliding the slider to change the output of the web application;
-
st.write multifunctional command, which can write anything using charts, data, and simple text. This feature will be detailed later.
1. Slider
streamlit.slider(label, min_value=None, max_value=None, value=None, step=None, format=None)2. Text Input
import streamlit as st
url = st.text_input('Enter URL')
st.write('The Entered URL is', url)
3. Checkbox
import streamlit as st
import pandas as pd
import numpy as np
df = pd.read_csv("football_data.csv")
if st.checkbox('Show dataframe'):
st.write(df)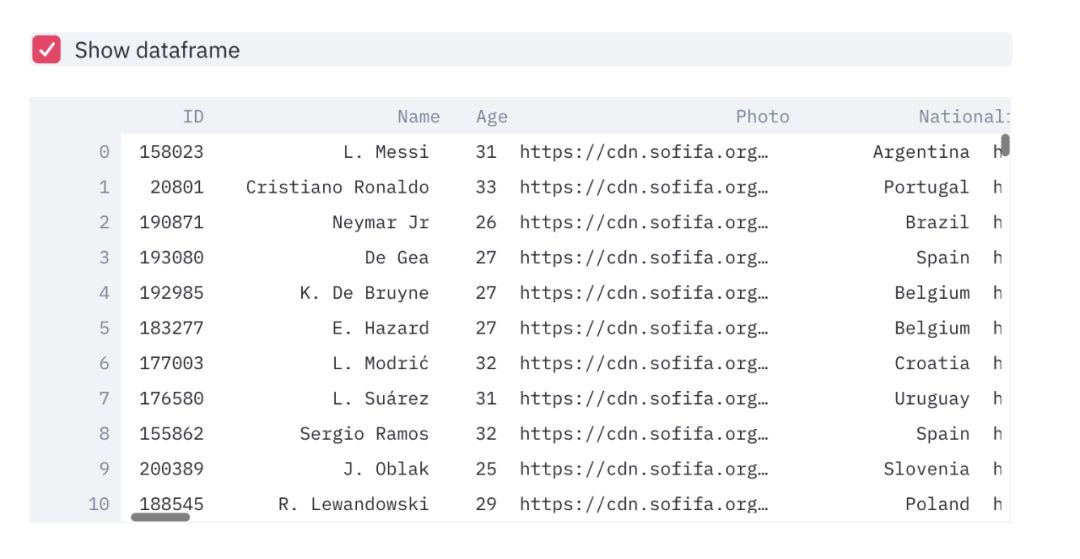 A simple checkbox widget application
4. Select Box
import streamlit as st
import pandas as pd
import numpy as np
df = pd.read_csv("football_data.csv")
option = st.selectbox(
    'Which Club do you like best?',
    df['Club'].unique())
st.write('You selected: ', option)
A simple dropdown/select box widget application
5. Multiselect
import streamlit as st
import pandas as pd
import numpy as np
df = pd.read_csv("football_data.csv")
options = st.multiselect(
 'What are your favorite clubs?',
 df['Club'].unique())
st.write('You selected:', options)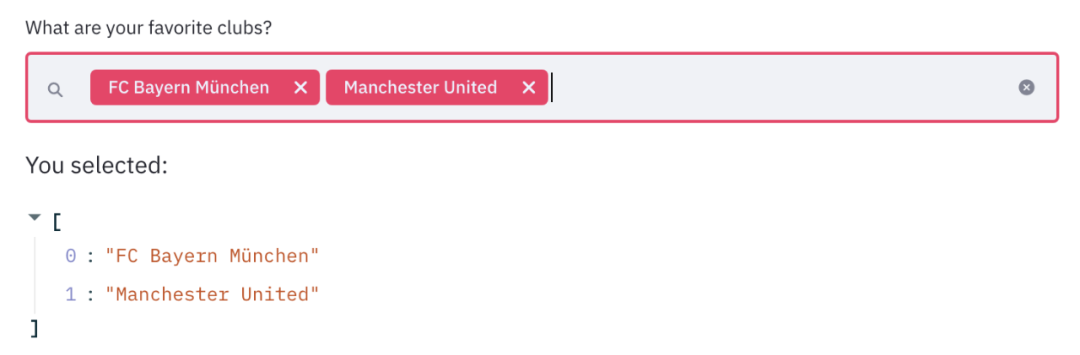
 import streamlit as st
import pandas as pd
import numpy as np
df = pd.read_csv("football_data.csv")
clubs = st.multiselect('Show Player for clubs?', df['Club'].unique())
nationalities = st.multiselect('Show Player from Nationalities?', df['Nationality'].unique())
# Filter dataframe
new_df = df[(df['Club'].isin(clubs)) & (df['Nationality'].isin(nationalities))]
# write dataframe to screen
st.write(new_df)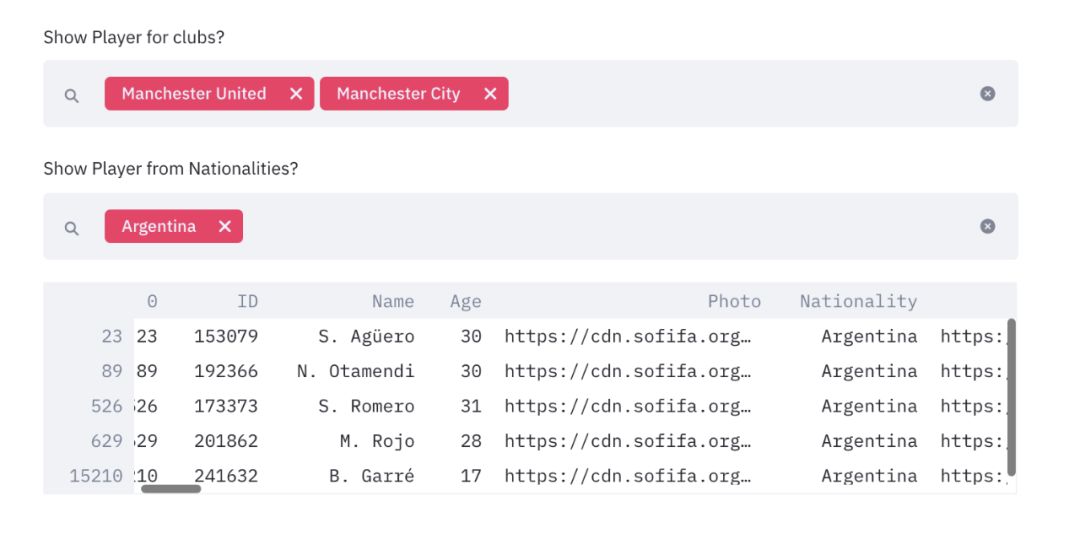 Comprehensive use of multiple widgets
import streamlit as st
import pandas as pd
import numpy as np
import plotly_express as px
df = pd.read_csv("football_data.csv")
clubs = st.multiselect('Show Player for clubs?', df['Club'].unique())
nationalities = st.multiselect('Show Player from Nationalities?', df['Nationality'].unique())
new_df = df[(df['Club'].isin(clubs)) & (df['Nationality'].isin(nationalities))]
st.write(new_df)
# create figure using plotly express
fig = px.scatter(new_df, x ='Overall',y='Age',color='Name')
# Plot!
st.plotly_chart(fig)Adding charts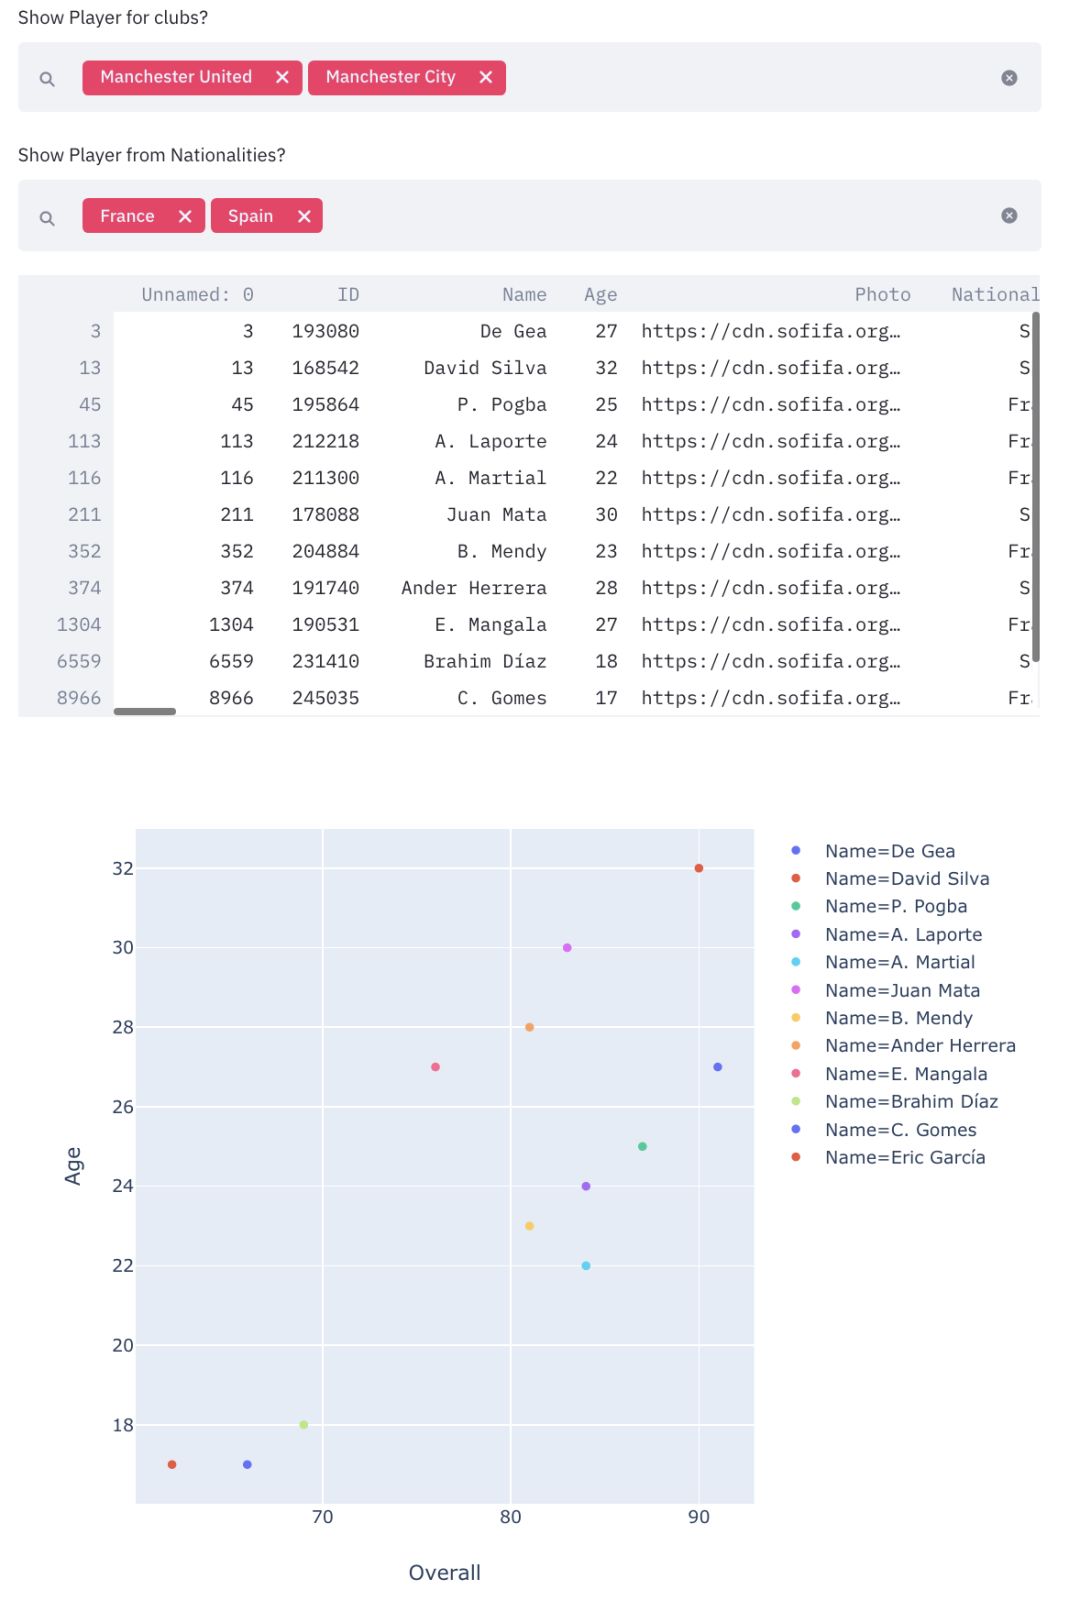
Adding charts
1. Caching
import streamlit as st
import pandas as pd
import numpy as np
import plotly_express as px
df = st.cache(pd.read_csv)("football_data.csv")@st.cache
def complex_func(a,b):
DO SOMETHING COMPLEX
# Won't run again and again.
complex_func(a,b)2. Toolbar
import streamlit as st
import pandas as pd
import numpy as np
import plotly_express as px
df = st.cache(pd.read_csv)("football_data.csv")
clubs = st.sidebar.multiselect('Show Player for clubs?', df['Club'].unique())
nationalities = st.sidebar.multiselect('Show Player from Nationalities?', df['Nationality'].unique())
new_df = df[(df['Club'].isin(clubs)) & (df['Nationality'].isin(nationalities))]
st.write(new_df)
# Create distplot with custom bin_size
fig = px.scatter(new_df, x ='Overall',y='Age',color='Name')
# Plot!
st.plotly_chart(fig)Move widgets to the sidebar
3. Markdown? (A markup language for plain text)
import streamlit as st
import pandas as pd
import numpy as np
import plotly_express as px
'''# Club and Nationality App
This very simple webapp allows you to select and visualize players from certain clubs and certain nationalities.'''df = st.cache(pd.read_csv)("football_data.csv")
clubs = st.sidebar.multiselect('Show Player for clubs?', df['Club'].unique())
nationalities = st.sidebar.multiselect('Show Player from Nationalities?', df['Nationality'].unique())
new_df = df[(df['Club'].isin(clubs)) & (df['Nationality'].isin(nationalities))]
st.write(new_df)
# Create distplot with custom bin_size
fig = px.scatter(new_df, x ='Overall',y='Age',color='Name')
'''### Here is a simple chart between player age and overall'''
st.plotly_chart(fig)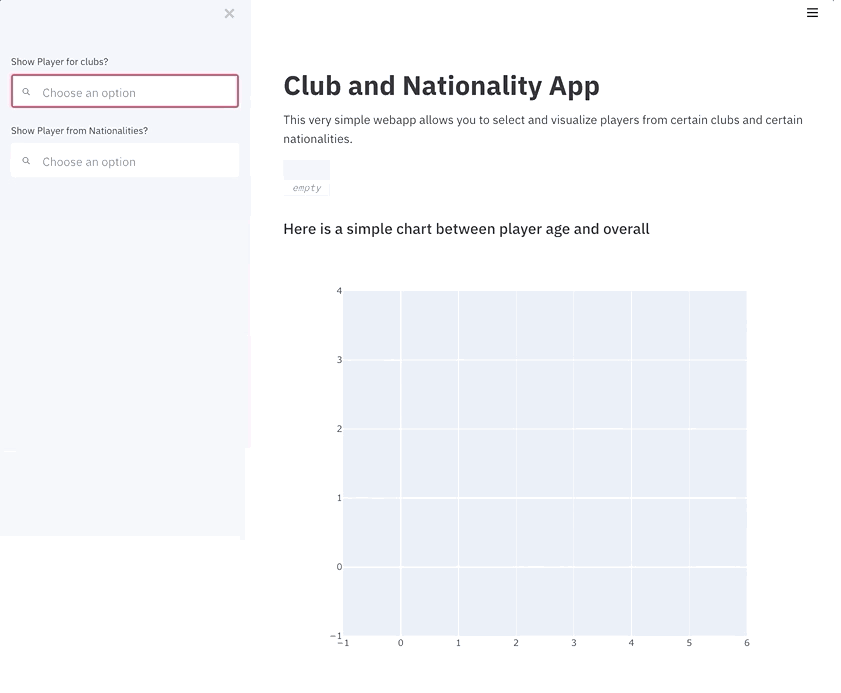
Conclusion

Author’s Bio:
Rahul Agarwal, Data Scientist at Walmart Labs.
Original Title:
How to Write Web Apps Using Simple Python for Data Scientists
Original Link:
https://www.kdnuggets.com/2019/10/write-web-apps-using-simple-python-data-scientists.html
Editor: Wang Jing
Proofreader: Gong Li
Translator’s Bio
Chen Zhiyan, graduated from Beijing Jiaotong University with a master’s degree in Communication and Control Engineering, has worked as an engineer at Great Wall Computer Software and Systems Co., Ltd. and Datang Microelectronics Company. Currently serves as technical support at Beijing Wuyi Chaoqun Technology Co., Ltd. Currently engaged in the operation and maintenance of intelligent translation teaching systems, with certain experience in artificial intelligence deep learning and natural language processing (NLP). In my spare time, I love translation creation, and my translation works mainly include: IEC-ISO 7816, Iraq Oil Engineering Project, New Fiscal and Taxism Declaration, etc. Among them, the English translation of “New Fiscal and Taxism Declaration” was officially published in GLOBAL TIMES. I hope to join the translation volunteer group of THU Data Party platform in my spare time to communicate and share with everyone and make progress together.
Translator Recruitment Information
Job Content: Requires a meticulous heart to translate selected foreign articles into fluent Chinese. If you are a data science/statistics/computer student studying abroad, or working overseas in related fields, or if you are confident in your foreign language skills, you are welcome to join the translation team.
What you can get: Regular translation training to improve volunteers’ translation skills, enhance understanding of cutting-edge data science, and overseas friends can keep in touch with domestic technology application development. The THU Data Party’s industry-academia-research background provides good development opportunities for volunteers.
Other Benefits: Data science workers from well-known companies, students from prestigious universities such as Peking University and Tsinghua University, and overseas students will become your partners in the translation team.
Click on “Read the original text” at the end of the article to join the Data Party team~
Reprint Notice
If you need to reprint, please prominently indicate the author and source at the beginning (reprinted from: Data Party ID: datapi), and place a prominent QR code for Data Party at the end of the article. For articles with original identification, please send [Article Name – Name of the authorized public account and ID] to the contact email to apply for whitelist authorization and edit as required.
After publishing, please feedback the link to the contact email (see below). Unauthorized reprints and adaptations will be pursued legally.
Click “Read the original text” to embrace the organization