

-
How to calculate feature importance using the gradient boosting algorithm. -
How to plot feature importance calculated by the XGBoost model in Python. -
How to perform feature selection using feature importance calculated by XGBoost.
print(model.feature_importances_)
# plot
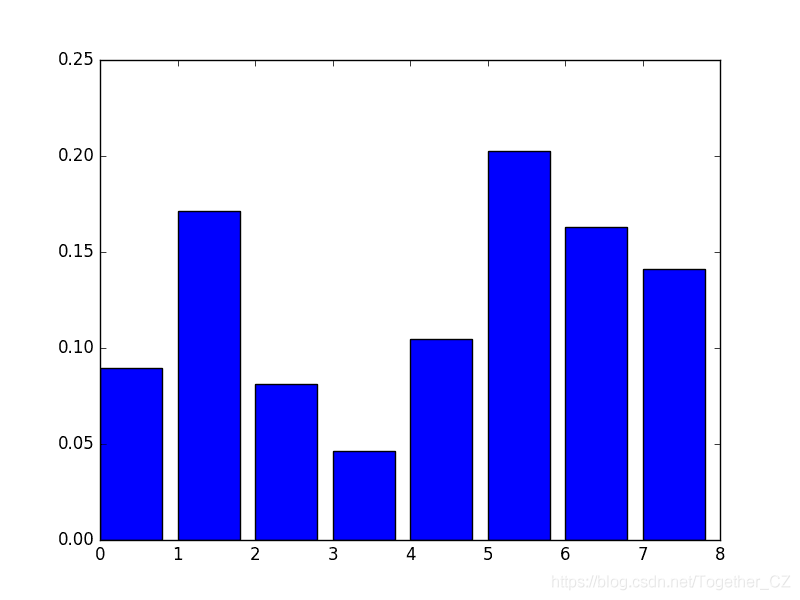
pyplot.bar(range(len(model.feature_importances_)), model.feature_importances_)
pyplot.show()
https://raw.githubusercontent.com/jbrownlee/Datasets/master/pima-indians-diabetes.csv
https://raw.githubusercontent.com/jbrownlee/Datasets/master/pima-indians-diabetes.names
# plot feature importance manually
from numpy import loadtxt
from xgboost import XGBClassifier
from matplotlib import pyplot
# load data
dataset = loadtxt('pima-indians-diabetes.csv', delimiter=",")
# split data into X and y
X = dataset[:,0:8]
y = dataset[:,8]
# fit model no training data
model = XGBClassifier()
model.fit(X, y)
# feature importance
print(model.feature_importances_)
# plot
pyplot.bar(range(len(model.feature_importances_)), model.feature_importances_)
pyplot.show()
[ 0.089701 0.17109634 0.08139535 0.04651163 0.10465116 0.2026578 0.1627907 0.14119601]
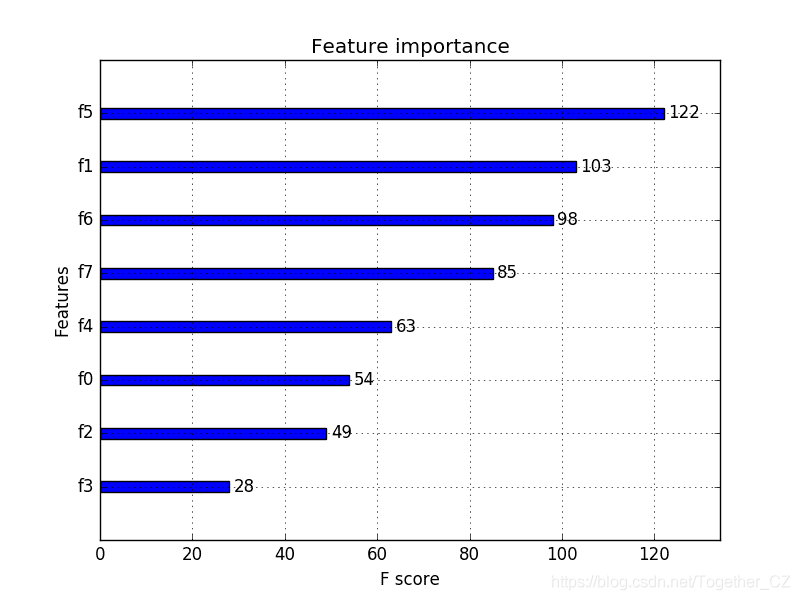
<span>plot_importance()</span> and can be used as follows:# plot feature importance
plot_importance(model)
pyplot.show()
<span>plot_importance()</span> function to plot the feature importance of the Pima Indians dataset.# plot feature importance using built-in function
from numpy import loadtxt
from xgboost import XGBClassifier
from xgboost import plot_importance
from matplotlib import pyplot
# load data
dataset = loadtxt('pima-indians-diabetes.csv', delimiter=",")
# split data into X and y
X = dataset[:,0:8]
y = dataset[:,8]
# fit model no training data
model = XGBClassifier()
model.fit(X, y)
# plot feature importance
plot_importance(model)
pyplot.show()
<span>SelectFromModel</span> class, which takes a model and can transform the dataset into a subset with selected features. This class can take a pre-trained model, such as one trained on the entire training dataset. It can then use a threshold to determine which features to select. When you call the<span>transform()</span> method on a<span>SelectFromModel</span> instance to consistently select the same features on the training and test datasets, this threshold will be used.<span>SelectFromModel</span> instance. We use it to select features on the training dataset, train the model on the selected feature subset, and then evaluate the model on the test set, following the same feature selection scheme.# select features using threshold
selection = SelectFromModel(model, threshold=thresh, prefit=True)
select_X_train = selection.transform(X_train)
# train model
selection_model = XGBClassifier()
selection_model.fit(select_X_train, y_train)
# eval model
select_X_test = selection.transform(X_test)
y_pred = selection_model.predict(select_X_test)
# use feature importance for feature selection
from numpy import loadtxt
from numpy import sort
from xgboost import XGBClassifier
from sklearn.model_selection import train_test_split
from sklearn.metrics import accuracy_score
from sklearn.feature_selection import SelectFromModel
# load data
dataset = loadtxt('pima-indians-diabetes.csv', delimiter=",")
# split data into X and y
X = dataset[:,0:8]
Y = dataset[:,8]
# split data into train and test sets
X_train, X_test, y_train, y_test = train_test_split(X, Y, test_size=0.33, random_state=7)
# fit model on all training data
model = XGBClassifier()
model.fit(X_train, y_train)
# make predictions for test data and evaluate
y_pred = model.predict(X_test)
predictions = [round(value) for value in y_pred]
accuracy = accuracy_score(y_test, predictions)
print("Accuracy: %.2f%%" % (accuracy * 100.0))
# Fit model using each importance as a threshold
thresholds = sort(model.feature_importances_)
for thresh in thresholds:
# select features using threshold
selection = SelectFromModel(model, threshold=thresh, prefit=True)
select_X_train = selection.transform(X_train)
# train model
selection_model = XGBClassifier()
selection_model.fit(select_X_train, y_train)
# eval model
select_X_test = selection.transform(X_test)
y_pred = selection_model.predict(select_X_test)
predictions = [round(value) for value in y_pred]
accuracy = accuracy_score(y_test, predictions)
print("Thresh=%.3f, n=%d, Accuracy: %.2f%%" % (thresh, select_X_train.shape[1], accuracy*100.0))
KeyError: 'weight'
<span>XGBClassifier</span> class that returns<span>None</span> for the<span>coef_</span> property. Below is the complete example.# use feature importance for feature selection, with fix for xgboost 1.0.2
from numpy import loadtxt
from numpy import sort
from xgboost import XGBClassifier
from sklearn.model_selection import train_test_split
from sklearn.metrics import accuracy_score
from sklearn.feature_selection import SelectFromModel
# define custom class to fix bug in xgboost 1.0.2
class MyXGBClassifier(XGBClassifier):
@property
def coef_(self):
return None
# load data
dataset = loadtxt('pima-indians-diabetes.csv', delimiter=",")
# split data into X and y
X = dataset[:,0:8]
Y = dataset[:,8]
# split data into train and test sets
X_train, X_test, y_train, y_test = train_test_split(X, Y, test_size=0.33, random_state=7)
# fit model on all training data
model = MyXGBClassifier()
model.fit(X_train, y_train)
# make predictions for test data and evaluate
predictions = model.predict(X_test)
accuracy = accuracy_score(y_test, predictions)
print("Accuracy: %.2f%%" % (accuracy * 100.0))
# Fit model using each importance as a threshold
thresholds = sort(model.feature_importances_)
for thresh in thresholds:
# select features using threshold
selection = SelectFromModel(model, threshold=thresh, prefit=True)
select_X_train = selection.transform(X_train)
# train model
selection_model = XGBClassifier()
selection_model.fit(select_X_train, y_train)
# eval model
select_X_test = selection.transform(X_test)
predictions = selection_model.predict(select_X_test)
accuracy = accuracy_score(y_test, predictions)
print("Thresh=%.3f, n=%d, Accuracy: %.2f%%" % (thresh, select_X_train.shape[1], accuracy*100.0))
Accuracy: 77.95%
Thresh=0.071, n=8, Accuracy: 77.95%
Thresh=0.073, n=7, Accuracy: 76.38%
Thresh=0.084, n=6, Accuracy: 77.56%
Thresh=0.090, n=5, Accuracy: 76.38%
Thresh=0.128, n=4, Accuracy: 76.38%
Thresh=0.160, n=3, Accuracy: 74.80%
Thresh=0.186, n=2, Accuracy: 71.65%
Thresh=0.208, n=1, Accuracy: 63.78%
Author: Yishui Hancheng, CSDN Blog Expert, personal research directions: Machine Learning, Deep Learning, NLP, CV
Blog: http://yishuihancheng.blog.csdn.net
Appreciate the Author

More Readings
Time Series Forecasting with XGBoost
Master Python Random Hill Climbing Algorithm in 5 Minutes
Understand Association Rule Mining Algorithm in 5 Minutes
Special Recommendations


Click below to read the original text and join the community membership