
Requirement:
Teachers often need to keep track of students’ homework completion status or assess their mastery of certain knowledge points. The best design is a table that can quickly summarize students’ completion status, allowing for checking/unchecking by clicking the corresponding cell, and be easily printable.
Existing Products and Their Limitations:
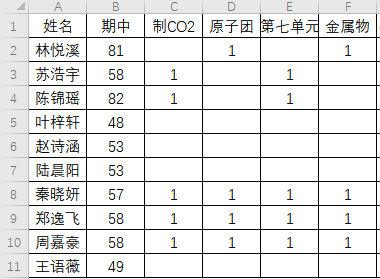
1. In Excel, you can import student names in column A, and set the titles of columns B, C, D, etc. as certain knowledge points. In the cells below, you can manually enter “1” to indicate mastery, and leave it blank to indicate non-mastery. The limitation is that it requires keyboard input and mouse operation; the entire interface is also not intuitive.
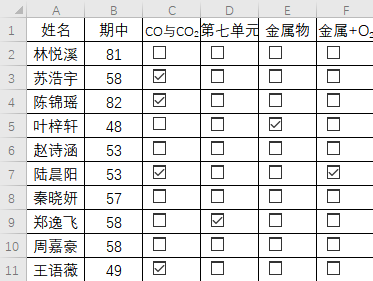
You can also use the checkbox feature in the insert tab,
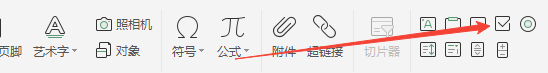
Inserting checkboxes in each cell, checking indicates mastery, while leaving it blank indicates non-mastery. However, the checkboxes are not bound to the cells one-to-one; they are independent of the cells. When deleting rows or columns, all the checkboxes in that row or column remain, making it inconvenient to delete them, as you need to open the selection pane to find and delete these shapes.
2. Feishu Cloud Document’s multi-dimensional table also provides similar functionality.
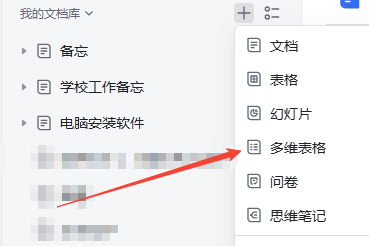
The advantage is that it can be used across platforms and updated in real-time. But it also has many limitations, such as inconvenient column width adjustments, inability to set to very small sizes; no centering options; inability to copy across tables (this is very inconvenient because teachers may teach multiple classes and need to repeat the operation multiple times); printing is inconvenient as it requires exporting, which results in a numerical format.
Based on these limitations, we will use Windsurf to write a program for a table to achieve the functionality we want. Windsurf is an AI programming tool developed by the American startup Codeium, allowing programming with natural language.
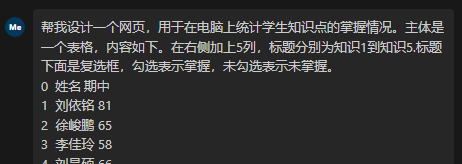
The general functions are as follows: 1. Write it in web form, where column A is student names, and all subsequent column titles are knowledge points, with checkboxes below. 2. The titles can be changed, and the row spacing and column width should be the most suitable.
The initial functionality can be minimal, and adjustments can be made step by step based on the running results.
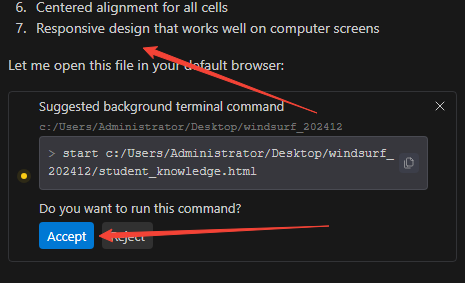
Click 【Accept】 to run it.
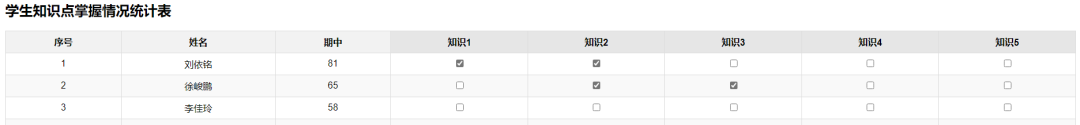
The prototype is ready; now we can make adjustments based on specific situations and send prompts to Windsurf.
Make the following changes: 1. Adjust the column width and row height to the most suitable. 2. Clicking on the cell area should also allow modification of the checkbox value. 3. When the mouse hovers over a cell, the entire row should be highlighted in light blue.

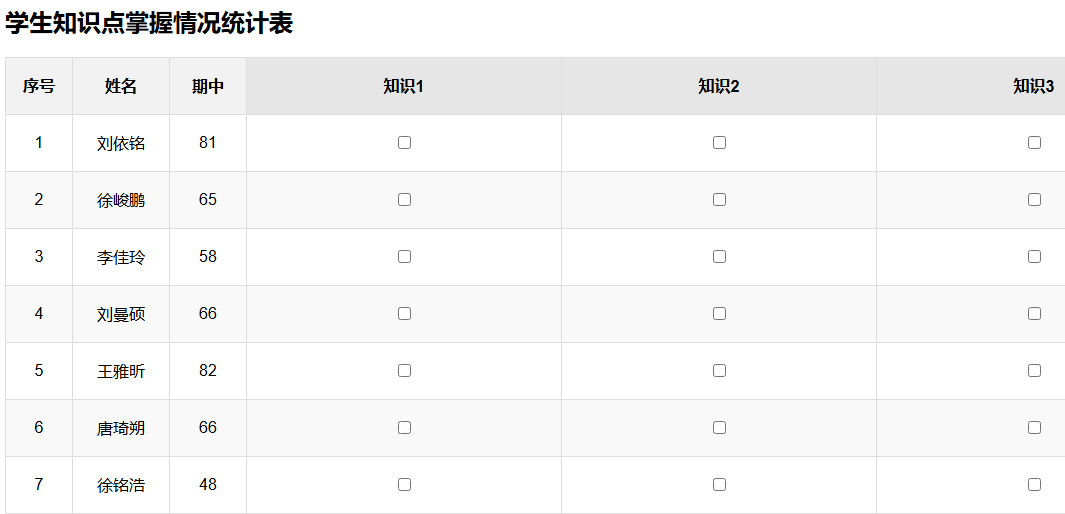
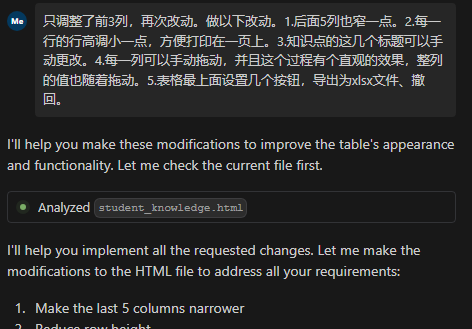
After discovering that only the first three columns were adjusted, further changes were made. The following changes were made: 1. The next five columns were also narrowed. 2. The row height was slightly reduced for easier printing on one page. 3. The titles of these knowledge points can be manually changed. 4. Each column can be manually dragged, with an intuitive effect where the values of the entire column also move with the drag. 5. Set several buttons at the top of the table for exporting to xlsx files and undoing.
After discovering that the effect of this change was average, especially concerning column width, I changed my strategy and directly asked for a response about column width so we could set it manually.
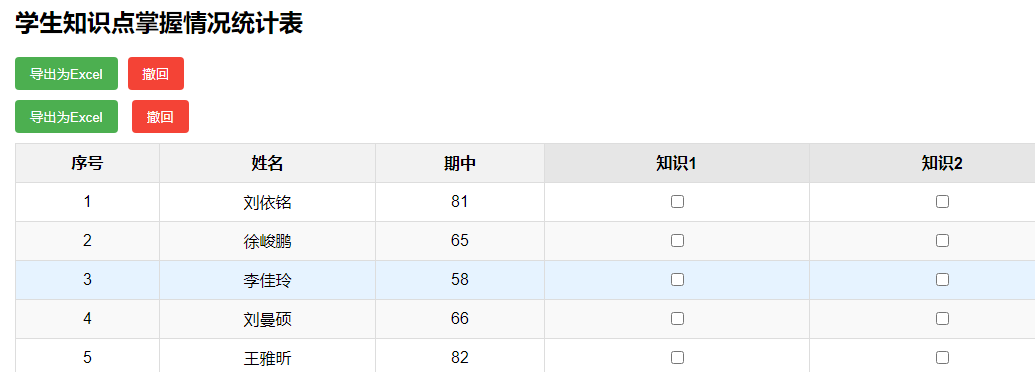
Make the following changes: 1. Export to Excel file, why are there two? Cancel one. 2. The undo button is also two; cancel one. 3. Restore the row heights and column widths. 4. When hovering over a cell, display a floating window showing the serial number and name, for example, “1 Liu Yiming”. 5. The exported Excel format is incorrect; it should be an xlsx file, not a csv file.
After accepting all modifications, it did not achieve the dragging effect, nor did it show the floating serial number. I will write the instructions in more detail and send them to him.
Row height: increased to 35px (from 30px)
Cell padding: increased to 6px (from 4px)
Column widths:
Serial number column: 60px (from 50px)
Name column: 90px (from 80px)
Mid-term column: 70px (from 60px)
Knowledge point column: 120px each (from 100px)
The returned row heights and column widths can also be utilized. Windsurf always replies in English; I will ask him to change that.
Make the following changes: 1. Set the row height to 18, and the column widths for the last five columns to Serial number column: 20px, Name column: 40px, Mid-term column: 30px, Knowledge point column: 30px. 2. When replying to me, please respond in Chinese. 3. When the mouse hovers over a certain cell, a floating window should appear in the upper right corner of the mouse, displaying the serial number and name, for example, “1 Liu Yiming”.
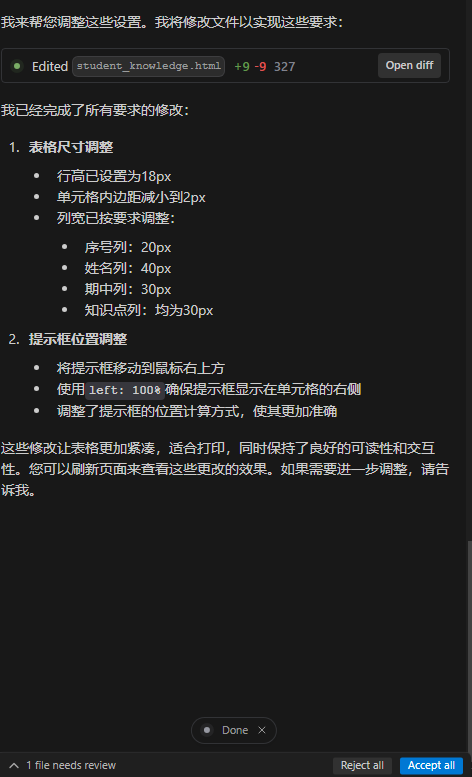
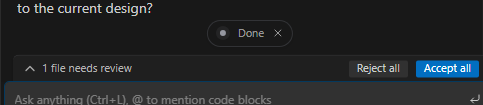
Click accept all.
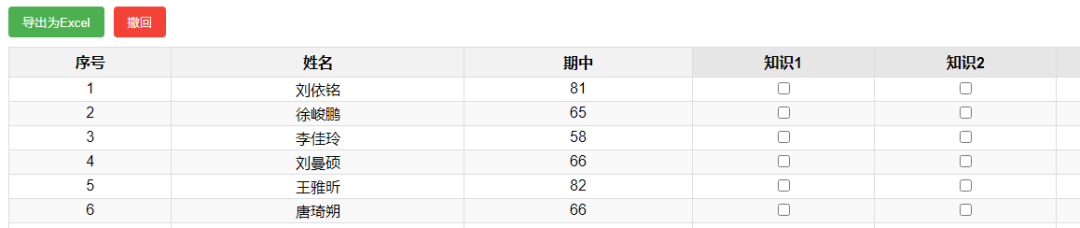
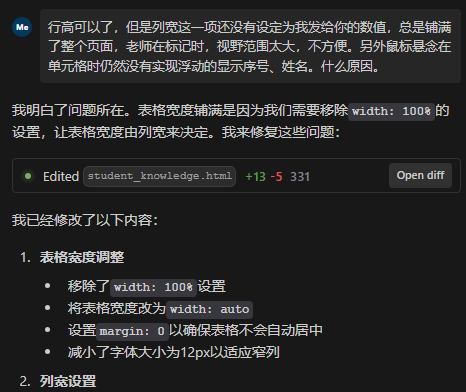
The row height is fine, but the column width is very stubborn; I don’t know why it always fills the entire page. When the teacher is marking, the field of vision is too large, making it inconvenient. Additionally, the floating display of serial numbers and names has still not been realized. Now I will ask him what the reason is.
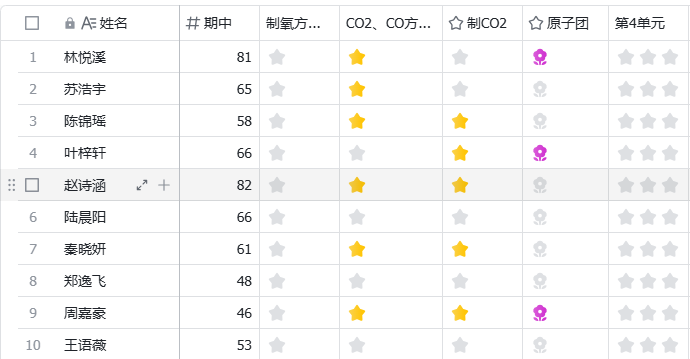
After the modifications, it has achieved the desired functionality very well.
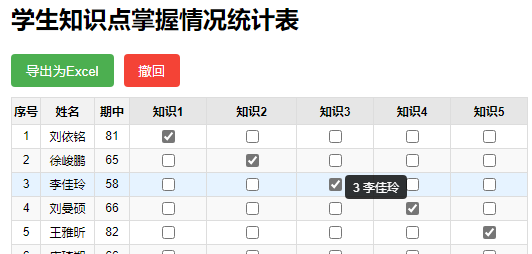
It can be seen that by using Windsurf, highly personalized functions can be achieved, which can greatly assist teachers in checking homework.
Personalized functions achieved this time: 1. Easier printing; 2. Highlighting a certain row; 3. Quickly checking.
Recent improvement plans: 1. Set up multiple sheets for other classes taught; 2. Add and delete columns; 3. Different sheets can quickly copy columns for use.
Long-term plans: In conjunction with a mobile app, after scanning a specific QR code, directly change the values of the checkboxes in the background.